A.1.9 - Correlation in ecological data
Ecologists often measure an organism and an environmental factor in the same place. Learn to plot those paired observations, calculate a rank correlation and judge its statistical support. You will also learn why even a convincing association needs further evidence before it can be called a cause.
Paired data and the biological question
A correlation question asks whether two measured variables tend to change together across a set of sampling units.
Correlation
A statistical association between two variables. A positive association means larger values of one tend to accompany larger values of the other; a negative association means larger values tend to accompany smaller values.
Each observation must be a pair: for example, soil water content and grass-shoot count measured in the same quadrat. Keep each pair together during processing. Pairing a moisture reading from one quadrat with a count from another would test an invented relationship.
The biological question determines the statistical test; the presence of a table does not.
| Biological question | Suitable approach, when its assumptions are met |
|---|---|
| Does shoot count tend to change as soil water content changes across paired quadrats? | A correlation coefficient for association between two variables. |
| Do two independently assigned treatments differ in mean seedling height? | An appropriate independent-samples t-test for a difference between means, with its distribution and variance assumptions checked. |
| Do observed offspring colour-category counts fit a specified 3:1 expectation? | A chi-squared goodness-of-fit test of observed against expected categorical counts, with suitable expected frequencies. |
Spearman's rank correlation is useful when the variables can be ordered and the question concerns a monotonic pattern: as one increases, the other tends consistently to increase, or consistently to decrease. The trend may curve; it need not be a straight line. It does not require the raw variables to be normally distributed. A Pearson correlation of the raw measurements instead describes linear association and has different assumptions for its significance test; it is not needed for the worked question here.
Pairs must be independent of other pairs for the simple test used in this lesson. The two measurements within a pair are deliberately linked. Ten readings of the same quadrat are repeated measurements of one sampling unit, not ten independent quadrats. Neighbouring quadrats can also resemble each other because of shared soil or shade. Plan spatial sampling and justify the unit of replication before choosing the test; random coordinates alone do not guarantee independence.
Plot the observations before calculating
A scatter diagram preserves the actual measurements and can reveal a pattern that a single coefficient would hide.
Consider this original illustrative dataset. It is a mathematical teaching example, not the result of a reported field investigation. Assume that eight randomly selected, well separated grassland patches provide independent sampling units. One 0.25 square metre quadrat is counted in each patch, with soil water content measured for that same quadrat. All counts refer to the same identified grass species and comparable sampling conditions.
| Patch | Soil water content / % | Grass shoots in 0.25 square metres |
|---|---|---|
| A | 12 | 4 |
| B | 15 | 9 |
| C | 18 | 7 |
| D | 21 | 15 |
| E | 24 | 12 |
| F | 27 | 20 |
| G | 30 | 17 |
| H | 33 | 24 |
Draw the scatterplot in a notebook before comparing it with panel A below. Put soil water content on the horizontal axis because it is the explanatory variable of interest, and shoot count on the vertical axis. In an observational study these axis choices do not establish that water content causes the count. Label both variables and their units or sampling area. Use regular, readable scales covering every observation; these axes need not start at zero, although panel A uses zero on the count axis.
Plot one point for every pair. For example, patch C is at horizontal coordinate 18% and vertical coordinate 7 shoots. Do not replace the eight observations with one mean or join them in patch-letter order. A carefully justified trend line may help describe a pattern, but no fitted line is needed to calculate Spearman's coefficient.
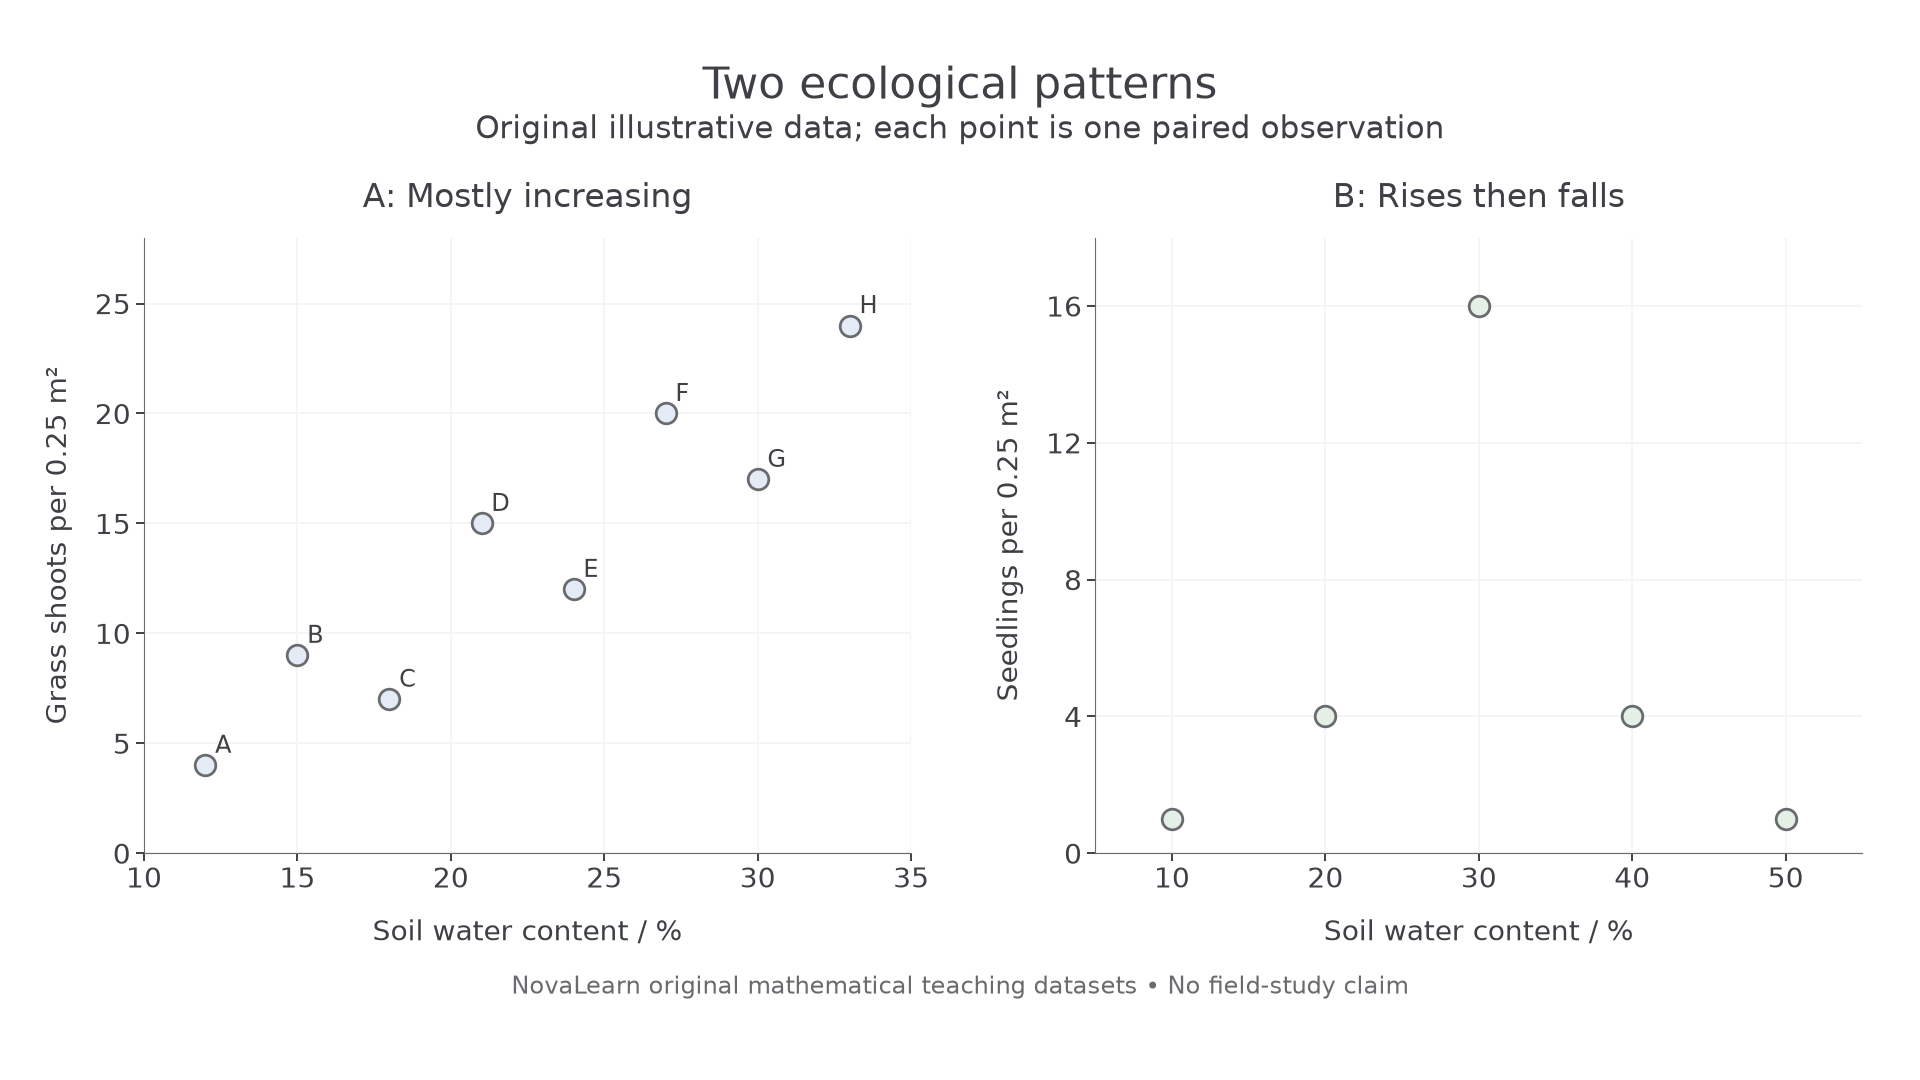
Panel A plots every value in the table. Panel B is a separate original illustrative dataset: water contents 10, 20, 30, 40 and 50%, paired with seedling counts 1, 4, 16, 4 and 1 per 0.25 square metres respectively.
Panel A suggests a positive monotonic association, with local reversals such as B to C. Strength concerns how consistently the ranks agree, not how steep the plotted trend looks: changing an axis scale changes the apparent steepness. Check unusual points against records and sampling conditions; do not delete an inconvenient observation merely to increase correlation.
Panel B has a clear non-monotonic pattern: seedlings are most numerous at intermediate water content. Its Spearman coefficient is zero because the increasing and decreasing rank trends cancel. Zero rank correlation therefore does not prove independence or the absence of every kind of relationship. Always inspect the scatterplot, including curved patterns and outliers, before interpreting a coefficient.
Calculate Spearman's coefficient without ties
Ranking replaces each measurement by its position within its own variable, while preserving the original pairs.
For each variable separately, give the smallest value rank 1, the next smallest rank 2, and so on. Use the same direction for both variables. Ranking the largest first in both columns also works; reversing only one column reverses the sign incorrectly. In the eight-patch dataset, every value within each variable is different, so there are no ties.
Let be the water-content rank and the shoot-count rank. For each patch calculate , then square it. The count 9 at patch B is the third smallest shoot count, so its rank is 3 even though B is the second row.
| Patch | Water rank | Shoot rank | ||
|---|---|---|---|---|
| A | 1 | 1 | 0 | 0 |
| B | 2 | 3 | −1 | 1 |
| C | 3 | 2 | 1 | 1 |
| D | 4 | 5 | −1 | 1 |
| E | 5 | 4 | 1 | 1 |
| F | 6 | 7 | −1 | 1 |
| G | 7 | 6 | 1 | 1 |
| H | 8 | 8 | 0 | 0 |
| Total | 36 | 36 | 0 | 6 |
For paired ranks with no ties in either variable:
Here is Spearman's rank correlation coefficient, is the number of complete independent pairs and is the sum of squared rank differences. The coefficient is dimensionless.
There are eight pairs, not sixteen independent observations. Substitute and :
The final subtraction from 1 is essential. A result must lie between −1 and +1. A value of +1 means perfect agreement of the two rank orders; −1 means a perfectly reversed rank order. Here the positive value near +1 describes a strong positive monotonic association in this sample. It does not measure how many extra shoots accompany a 1% water-content increase, because ranking discards the original intervals between measurements.
Use a stated significance rule
A coefficient with a large magnitude needs a test rule before it can support a claim about the population represented by the sampling.
For the eight-patch investigation, set the hypotheses and significance level before looking for a favourable result:
- Null hypothesis, : soil water content and grass-shoot count are independent in the sampled population; the null model predicts no association.
- Alternative hypothesis, : there is a monotonic association between soil water content and grass-shoot count, in either direction.
This is a two-sided test because a sufficiently strong positive or negative rank association counts against the null. A one-sided alternative would predict a stated direction in advance and require its matching critical rule. Do not choose a one-sided test after noticing the direction of the data.
Continue this lesson.
You’re previewing NovaLearn without an account. Create a free account to read the rest.
Create free account