1.17, Core practical 1 - Caffeine, Daphnia and research ethics
A translucent water flea lets you observe a beating heart without dissection. Core practical 1 uses this to investigate caffeine, while 1.17 asks whether the information gained justifies the risks to the invertebrates. You will plan a controlled investigation, process its measurements and judge what its evidence can support.
A visible heart and a testable hypothesis
Daphnia are small freshwater crustaceans whose translucent bodies make their hearts visible with a low-power light microscope. Their heart moves fluid around the body, but its structure and control differ from those of a mammalian heart. A Daphnia response is therefore useful biological evidence, rather than a direct prediction of what caffeine will do to a human.
Heart rate
The number of heartbeats per unit time, commonly reported as beats per minute.
Use transmitted light, which passes through the specimen from below. Locate the small heart on the dorsal side, meaning the back: it is above the gut and in front of the brood pouch. Watch the heart itself contract and relax. Rapid movements of the appendages or gut are different events and must not be counted as heartbeats.
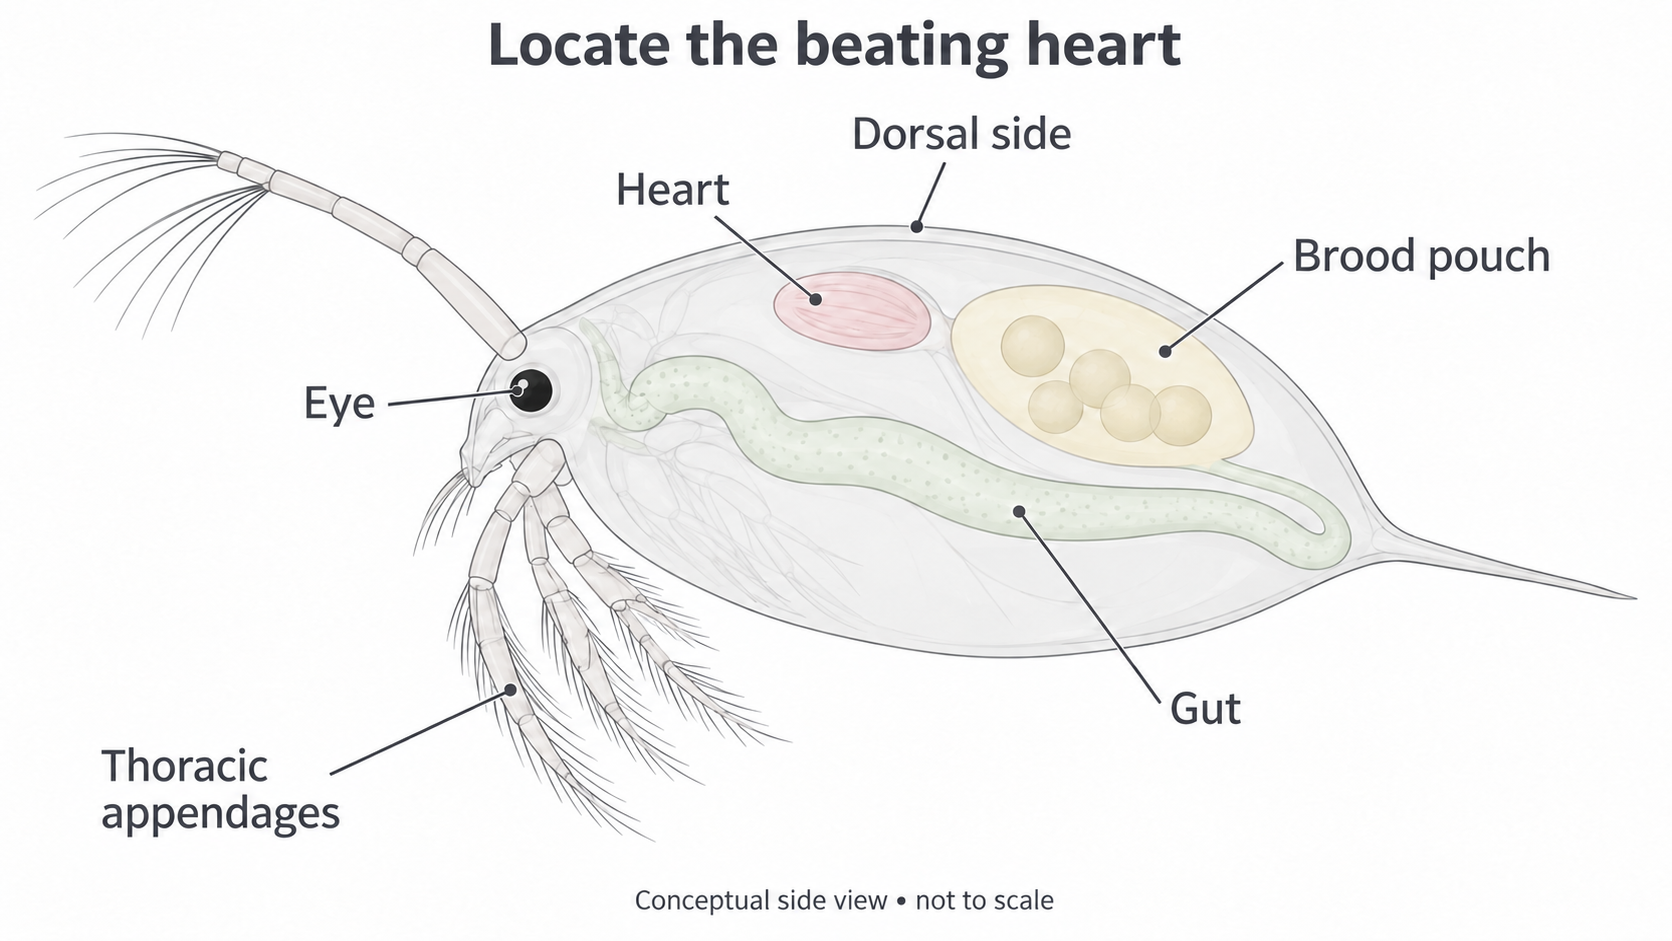
The heart is on the dorsal side, anterior to the brood pouch. This simplified illustration locates structures; it is not a micrograph or a calibrated image.
A testable question specifies both the treatment and the response: “Does the concentration of caffeine in the surrounding water affect Daphnia heart rate during a fixed brief exposure?” The independent variable is the concentration deliberately changed. The dependent variable is the measured heart rate, or its change from the same animal's baseline.
One possible hypothesis predicts an increase as concentration rises. That prediction must be tested, not built into the counting. The official practical guidance reports that clear increases are not consistently obtained. A decrease or no detectable change is a legitimate result. Neither a flat graph nor one unusual animal justifies escalating exposure to force the predicted pattern.
A phone or microscope camera can record a timed observation for slow replay. Count beats over the original recording duration, not the longer playback duration. The video also lets two observers check whether they identified the same movements.
Welfare before exposure
A scientifically useful experiment still needs an ethical justification for using living animals. The benefit here is learning how to measure a physiological response and evaluate experimental evidence. The possible costs include handling stress, restricted movement, altered water conditions and harmful caffeine exposure. Daphnia cannot give consent, so the investigator is responsible for their treatment.
It is not established that every invertebrate experiences pain in the same way as a mammal. Equally, a simple nervous system does not prove an absence of adverse experience. Harm, such as impaired swimming or death, can occur regardless of what is known about subjective pain. Uncertainty supports proportionate precautions, rather than treating the animals as disposable apparatus.
The three Rs help turn that responsibility into practical choices:
| Principle | Application to this investigation |
|---|---|
| Replacement | Use existing heartbeat videos and datasets when they meet the learning aim without a new exposure. They support counting and analysis, although they do not demonstrate the learner's live handling competence. |
| Reduction | Pool a well-designed class dataset and justify the number of independent animals needed. An experiment too small or too confounded to answer its question wastes animals; repeatedly exposing one animal is not automatically the better choice. |
| Refinement | Use gentle transfers, suitable culture water, minimal restraint, brief low-concentration exposure, stable conditions and an immediate stopping rule. Improve welfare throughout housing, observation and recovery. |
A benefit–harm judgement can support a carefully controlled live investigation if the learning benefit is substantial, a suitable alternative is insufficient and likely harm is minimised. Another defensible position gives animals a strong claim against imposed harm and favours a video alternative for an educational exercise. Discuss the actual benefit, alternatives, risks and uncertainty before reaching a reasoned decision; “they are only invertebrates” is not a justification.
The teacher must approve the protocol, concentration range and exposure limit using current local safety guidance and a small welfare-focused pilot. A solution that is low hazard to students is not thereby harmless to Daphnia. The Pearson worksheet warns that high concentrations can kill them; its historical report of no immediately visible ill effect at some concentrations is not a guarantee of safety for another culture or exposure duration.
Watch for impaired swimming, abnormal posture, failure to recover or an abnormal/undetectable heartbeat. Stop the exposure immediately, inform the teacher and transfer the animal gently to suitable clean recovery water. Do not continue counting to complete a table. Use a separate labelled recovery container so exposed animals are not accidentally selected again or caffeine carried into the stock culture. A teacher decides whether a recovered animal can return to its appropriate culture and how an injured or dead animal is handled under the centre's welfare protocol. Do not release laboratory organisms or treated water into a natural pond, or pour living animals down a drain.
A controlled caffeine investigation
A paired baseline measurement helps separate a treatment response from differences between animals. Measure each animal in caffeine-free culture water, then after one assigned treatment. Use different animals for different concentrations, including a caffeine-free handling control. This avoids carrying the effects of an earlier caffeine exposure into a later concentration.
Prepare the apparatus and solutions
Use a healthy culture of the same Daphnia species; two small shallow observation dishes per animal; a low-power transmitted-light microscope, preferably with LED illumination; a few loose cotton fibres if needed; wide-bore plastic transfer pipettes; labelled beakers; measured-volume pipettes or syringes; a thermometer; a stopclock; and, if available, a camera. Choose measurement apparatus with enough resolution for the required volumes. Never mouth-pipette. Do not use a cover slip that crushes the animal or restricts water exchange.
The following is a conservative example plan for teacher approval, not a universal safe-dose instruction. Nuffield's practical guidance uses a dilute caffeine stock of 0.3 g per litre and further dilutes a drop in 5 cm³ of water. Here measured volumes replace an unspecified drop. A technician prepares a 300 mg per litre stock with suitable culture water and makes a tenfold dilution: 1.00 cm³ stock plus 9.00 cm³ culture water gives a 30 mg per litre working solution. Using culture water for every dilution keeps the water composition consistent. Pure caffeine of known composition is preferable to coffee, which introduces other substances.
Mix each bath thoroughly before introducing an animal. The preparation equation is:
Use matching volume units in the ratio; the bath has the same concentration unit as the working solution.
For example, .
| Working solution / cm³ | Added culture water / cm³ | Total bath / cm³ | Nominal caffeine concentration / mg per litre |
|---|---|---|---|
| 0.00 | 5.00 | 5.00 | 0.0 |
| 0.10 | 4.90 | 5.00 | 0.6 |
| 0.20 | 4.80 | 5.00 | 1.2 |
| 0.50 | 4.50 | 5.00 | 3.0 |
These low concentrations may produce no detectable response. The centre must pilot their suitability and the timing for its animals before students proceed. If this plan cannot give useful evidence without unacceptable harm, use existing data for analysis and revise the investigation with the teacher. Do not increase the dose independently.
Measure a baseline and one treatment
- Bring baseline water, treatment baths and animals gently to the same approved culture temperature; avoid sudden cooling or heating. For this example, maintain 20 °C within about 1 °C and record actual temperatures. Keep water oxygenated before use, with the same shallow volume exposed to air during observations.
- Allocate similar-sized, healthy animals randomly among the four coded bath groups. The teacher sets and justifies the number from pilot variability, the learning aim and welfare; several independent animals at each concentration are needed. The observer should not know which codes contain caffeine until counting is complete.
- Place an animal in 5.00 cm³ caffeine-free culture water in the baseline dish using a wide-bore pipette. If loose fibres are needed to reduce movement, use the minimum and never pin or compress the animal. Locate the heart at low power. Allow the fixed approved settling time; in this example it is 2 minutes.
- Count three consecutive 20-second periods, recording each count immediately. One person times while another taps a pencil once per beat and later counts the dots, or both use the recording. Switch off the lamp between observations and keep the dish away from heating sources. Record any loss of view; never invent a count.
- Transfer the same animal gently to a fresh dish of its one assigned bath. Use the smallest practicable measured carry-over of baseline water without drying the animal, and record it. Start the exposure clock at entry. After 2 minutes, take the same three 20-second counts, completing this example's caffeine exposure at 3 minutes. Use the identical transfer and timing for the 0.0 mg per litre control.
- End sooner if the stopping rule is reached. Transfer the animal to its labelled clean recovery container, observe recovery and record what happened. Use fresh clean dishes/transfer equipment to prevent cross-contamination. Repeat the baseline–treatment pair with independent animals, not by giving one animal the whole concentration sequence.
A small carried volume dilutes a treatment bath. For 0.05 cm³ carried into a 5.00 cm³ bath, the final concentration is the nominal concentration multiplied by , about 0.99. Keep transfer volumes small and consistent, report that the concentrations are nominal, and include this limitation. Removing every trace of water by leaving the animal dry would be an unacceptable way to improve concentration accuracy.
Why the controls matter
| Variable or comparison | Control and reason |
|---|---|
| Water temperature | Measure and maintain it: Daphnia body temperature follows the environment, so temperature changes can alter metabolism and heart rate. |
| Water composition and oxygen availability | Use the same suitable culture water, shallow bath volume and preparation. Water conditions can change physiology independently of caffeine. |
| Time and handling | Keep settling, exposure, counting and transfer procedures fixed. The caffeine-free transfer group reveals changes associated with handling or elapsed time. |
| Animal differences | Use one species and comparable size/stage, random allocation and each animal's own baseline. This reduces rather than abolishes biological variation. |
| Observation | Use the same optical conditions and coded treatments. Masking the counter reduces expectation bias; slow replay can reveal missed beats. |
Wear eye protection when preparing/handling solutions if required by the centre's risk assessment; keep chemicals away from mouths and eyes, wash hands after handling water/animals and clean spills promptly. Culture water may contain microorganisms. Avoid contaminated wild pond water, keep electrical equipment dry and handle glassware carefully. Follow the teacher's separate waste instructions for solutions and organisms.
Counts, rates and independent animals
A timed count becomes a rate only after the duration is included. Keep raw counts as whole numbers and retain the original observation times.
The result is in beats per minute. For a 20-second count, multiply the count by 3.
Suppose one animal gives baseline counts 59, 61 and 60 over three 20-second periods. The mean count is ; its mean baseline rate is beats per minute. After its assigned treatment, counts 63, 62 and 64 have mean 63, giving 189 beats per minute. The paired change is beats per minute. A positive sign means an increase; a negative sign means a decrease.
When periods have equal durations, converting their mean count gives the same result as averaging their rates. For unequal durations, first calculate each rate; do not average unequal-duration counts and multiply by one conversion factor. Keep unrounded values during calculations and round the final rate to a precision the observations support. A decimal-rich calculator output does not make an uncertain count more precise.
Three windows from the same animal are repeated measurements. They help assess counting repeatability and short-term changes, but they are not three independent animals. In the worked example the biological sample size is one. Taking 30 counts from it still leaves one animal.
For a concentration group, first calculate each independent animal's mean baseline, mean treatment rate and paired change. Then calculate the arithmetic mean of those animal changes. Give each animal equal weight rather than allowing an animal with more usable windows to dominate. For changes +9, +3 and −3, the group mean is beats per minute, with three independent animals.
A paired design reduces the influence of different initial rates. It does not remove a time effect: baseline always precedes treatment. Compare the mean paired change with the caffeine-free handling control. If both groups rise similarly, handling or elapsed time may explain the rise. Reusing one animal across ascending concentrations also confounds dose with exposure order, accumulated caffeine and fatigue; fresh independent animals for each concentration avoid that sequence problem.
Uncertainty and justified precision
Measurement uncertainty is the interval of plausible measurement values, rather than a licence to ignore a mistake. Counting a leg instead of a heartbeat is a measurement error requiring correction. Missing a few rapid beats, uncertain start/stop timing and gradual temperature drift can all limit a valid observation.
An absolute uncertainty has the unit of the measurement, such as ±2 beats. A percentage uncertainty expresses its size relative to the measured value:
For a quotient such as count divided by time, a simple conservative estimate adds the percentage uncertainties of numerator and denominator. Multiplying by the exact conversion factor 60 adds no uncertainty.
Suppose checks of video counting support an estimated count uncertainty of ±2 beats, while repeated timing checks support seconds. These are stated estimates, not universal properties of every counter or stopclock. A stopclock displaying hundredths of a second does not remove human reaction uncertainty.
For a count of 60, the count percentage uncertainty is . The time percentage uncertainty is . Add them for a conservative estimate of . The rate is 180 beats per minute, so its absolute uncertainty is beats per minute. Reporting approximately beats per minute is more honest than reporting 180.000. The uncertainty is an estimate and the rate is rounded to whole beats per minute.
When subtracting two measured rates, add their absolute uncertainties for a simple conservative uncertainty in the change. If each rate has an estimated uncertainty of ±11 beats per minute, a difference of +9 has uncertainty about ±22 beats per minute. That one pair does not resolve a definite increase. This addition is a cautious bound; shared errors can be correlated, so it is not a statistical confidence interval.
Repeating valid counts can reveal random scatter and improve the estimate of an animal's mean, but does not automatically eliminate systematic undercounting or lamp heating. Several independent animals reveal biological variability. Neither repeated windows nor more animals repairs a confounded comparison. A longer original recording may reduce the relative effect of a missed beat or start/stop error, but prolonged exposure and changing rate can make it unsuitable; slow replay of a brief recording can improve counting without extending exposure.
Graphs, conclusions and a practical record
A graph should show the actual response with its variation, rather than a pattern the observer expected. The following complete dataset is original teaching data, constructed for analysis practice; it is not the result of a performed experiment. Each row contains three different animals, and each listed rate is that animal's mean of equal-duration windows.
| Nominal caffeine concentration / mg per litre | Baseline rates / beats per minute | Rates after treatment / beats per minute | Paired changes / beats per minute | Mean paired change / beats per minute | Smallest to largest change / beats per minute |
|---|---|---|---|---|---|
| 0.0 | 180, 186, 174 | 183, 183, 174 | +3, −3, 0 | 0 | −3 to +3 |
| 0.6 | 177, 189, 180 | 180, 189, 186 | +3, 0, +6 | +3 | 0 to +6 |
| 1.2 | 183, 174, 192 | 189, 177, 189 | +6, +3, −3 | +2 | −3 to +6 |
| 3.0 | 180, 186, 177 | 189, 183, 186 | +9, −3, +9 | +5 | −3 to +9 |
Construct the graph
Put concentration, the independent quantitative variable, on the horizontal axis and mean paired change on the vertical axis. Label both quantities and units. Use a continuous numerical concentration scale: the distance from 1.2 to 3.0 must be three times the distance from 0.0 to 0.6. Equally spacing those four labels would misrepresent the data. Include negative values on the response axis and mark zero clearly.
On graph paper, choose scales that use most of the plotting area, plot the four coordinates , , and , and check each against the table. Add vertical bars spanning each group's smallest to largest animal change, and state what the bars mean. These bars describe observed spread, not the instrument uncertainty or a confidence interval. The figure below is an exact plot of these values. Four small groups do not justify inventing a smooth dose–response curve; the means are left unconnected.
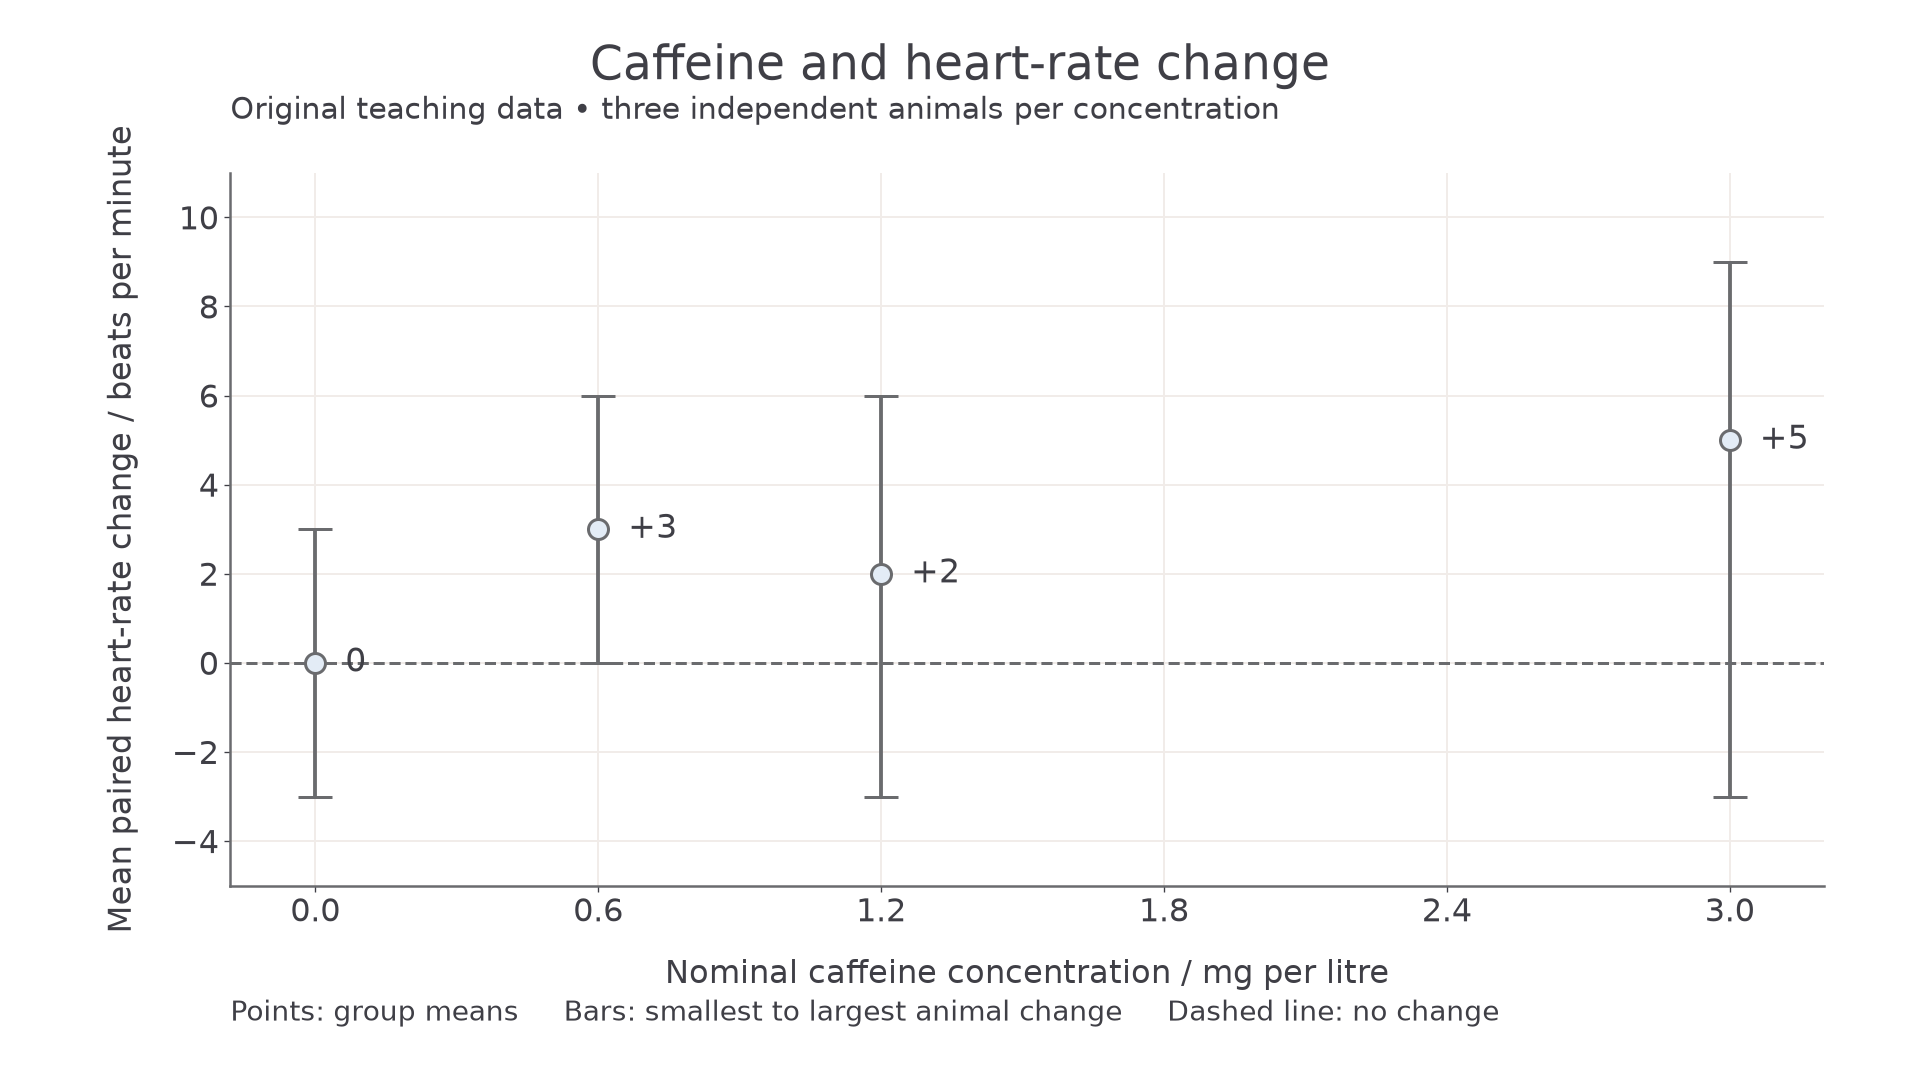
Original teaching data: the large points are group means, and each bar spans the three independent animals' smallest to largest change. The dashed horizontal line marks no change.
Limit the conclusion to the evidence
The largest-concentration group has mean change +5 beats per minute compared with 0 in the handling control. However, the intermediate means are +3 and +2, so they do not rise steadily with concentration. At 3.0 mg per litre, one animal decreased while two increased. The group spreads overlap, and all include zero. These small constructed samples give weak evidence for a consistent dose-dependent increase.
Overlap alone is not a formal significance test. Without a suitable statistical analysis, do not report “statistically significant” or “proved no effect”. A useful conclusion is that this dataset does not demonstrate a clear caffeine response under these conditions; a small effect could be obscured by counting uncertainty and animal variation. A controlled intervention can support a causal explanation if the comparison is valid, but uncontrolled heating or handling would undermine that inference. Human responses cannot be inferred directly from this species and water exposure.
Consider this original NovaLearn practice report:
Twelve Daphnia were allocated to four caffeine concentrations, with three animals per group. Each animal was measured before and after its assigned bath. The highest group's mean change was +5 beats per minute and the handling control's mean change was zero. The report concluded that caffeine always accelerates a human heart.
The numerical statement describes the table, but the final claim goes beyond it. “Always” ignores within-group differences; “human” changes the organism being studied. Cite the actual changes and methodological limits when evaluating such a source. Even a correctly calculated mean does not validate every claim attached to it.
Preserve an independent practical record
Keep an individual contemporaneous record: date, aim/hypothesis, approved method, animal and coded bath identities, stock/dilution volumes, nominal concentrations, transfer volume, actual temperature, settling/exposure times, every raw count and its duration, counting difficulties, stopping events and recovery observations. Retain raw data when calculating means, changes and graphs. If an animal moved out of view, record the unusable window and reason; do not silently delete an inconvenient result or replace it with an invented value. Shared class data should identify their contributors separately from the observations you made yourself.
Cite the source used to plan the method with its creator, title, URL or publication details and access date; explain any adaptation. A primary practical guide gives traceable apparatus and safety information, while a copied revision summary may omit important conditions. Search online and consult your centre's printed practical/safety guidance, then judge relevance and reliability instead of treating the first search result as authority.
Online Study can prepare you to plan, measure, analyse and discuss Core practical 1. The separate practical endorsement requires the centre to observe and authenticate individual practical competence and appropriate records; completing this lesson, viewing a video or obtaining a written-test score cannot award it.