Core practical 4 - Enzyme concentration and initial rates
An enzyme can make a reaction faster without increasing the amount of product eventually available from a fixed amount of substrate. Investigate how enzyme concentration and substrate concentration affect the rate at the start, then use graphs and uncertainty to decide what the results support.
Measuring the start of a reaction
A fair concentration comparison needs a rate measured before the reaction has substantially changed its own conditions.
Initial rate
The instantaneous rate at the start of a reaction, estimated from the gradient of the initial tangent to a suitable quantity–time curve.
An enzyme's active site binds a suitable substrate, forms an enzyme–substrate complex and releases products. The enzyme can act again. Increasing the number of available enzyme molecules may therefore increase product formation per second; it does not create additional substrate.
As a reaction proceeds, substrate is used up. Fewer substrate molecules may be available to encounter active sites, and products accumulate. The rate often falls. Comparing the initial rates compares mixtures at their stated starting concentrations, before different amounts of depletion obscure the effect being investigated. In an enzyme-concentration series, the starting substrate concentration must be the same; in a substrate-concentration series, its deliberate difference is the independent variable.
Catalase provides a useful measurable system. It catalyses the breakdown of hydrogen peroxide, the substrate, into water and oxygen:
At constant gas temperature and pressure, oxygen volume is proportional to the amount of oxygen. A gas syringe can follow product volume continuously. A rate in is an oxygen-production rate, rather than a direct count of substrate molecules used each second. Because two peroxide molecules produce one oxygen molecule, conversions between their molar rates must respect the equation.
A single reading after 60 seconds gives a volume made during 60 seconds. Dividing it by 60 gives an average rate over that interval. It gives a good approximation to the initial rate only if evidence shows negligible rate change over that short interval. A visibly bending curve requires an initial tangent. The final gas volume measures yield, not speed.
Choosing a detection method
The measurement must respond to a substrate or product, and its limitations determine what rate can be calculated.
Gas collection follows oxygen production without taking samples out of the catalase mixture. A pressure sensor in a suitable closed vessel is another possibility, but its reading also depends on gas temperature and headspace volume. A pressure trace cannot simply be relabelled as gas volume. An instrument must be zeroed, checked for a usable range and used consistently.
Continuous colorimetry
Trypsin, a protease, breaks down casein in a milk suspension. As the suspension clears, its measured absorbance falls. In a supervised alternative investigation, prepare trypsin dilutions, equilibrate reagents in the same water bath, and mix equal volumes of the enzyme dilution and the same milk suspension in a cuvette. Use a red filter and zero the colorimeter with a matching enzyme-and-solvent reference without milk. Keep cuvette orientation, fill volume and filter constant; wipe its clear faces, avoid bubbles and use unscratched cuvettes. Start recording immediately on mixing, preferably with a light sensor/data logger, and collect enough early readings to resolve the initial change. Repeat independently at each concentration.
The initial absorbance gradient is negative. Its magnitude, , is a positive clearing-rate proxy. Absorbance is dimensionless, so its change per second has units , sometimes described as absorbance units per second. Without a calibration linking the optical signal to a known amount of substance, this is not a molar rate. Different starting milk concentrations also change the starting optical signal: check the instrument's useful range and calibration before comparing substrate-series rates. Pearson's trypsin practical resource supports this assay.
A qualitative starch test
Amylase breaks starch into smaller carbohydrates. Iodine solution gives a blue-black colour when detectable starch is present; a negative test retains the iodine's orange-brown colour. It does not identify a particular sugar product. To practise the reagent technique, place separate drops of dilute iodine solution on a white spotting tile. Include a starch-plus-iodine positive control and a water-plus-iodine negative control. Use teacher-supplied fresh 0.5% amylase and 0.5% starch solutions (mass per volume). Equilibrate separate measured portions of 2.0 amylase, 2.0 starch and 1.0 pH 6 buffer at 25 °C. The teacher pilots the enzyme batch first so the endpoint is not reached before the first sample. Mix to start the reaction, start a timer and transfer a small, consistent drop into a fresh iodine drop every 10 seconds. Keep iodine out of the reaction tube and use clean sampling equipment. Record the first negative test alongside the previous positive time, and repeat with fresh mixtures. Wear eye protection; iodine stains and can irritate eyes. The teacher prepares enzyme solutions to avoid inhaling enzyme powder and checks the buffer's hazards.
If the last positive sample is at 40 seconds and the first negative at 50 seconds, disappearance below the test's detection threshold occurred within that interval. The endpoint has limited time resolution. With a fixed starting substrate amount and threshold, can compare average reaction speeds. It is not an initial tangent, and changing the starting substrate amount makes an unqualified comparison especially misleading. Quantitative early concentration measurements would be needed to construct a substrate–time curve. This distinction is why the main investigation below uses continuous gas collection. The Nuffield/Practical Biology amylase method supports the reagent and sampling approach.
Preparing known concentrations
Dilution changes concentration by adding solvent while conserving the amount of the substance in the portion transferred.
Use the total final volume, not just the volume of diluent. The two volumes must use the same units; the new concentration then has the old concentration's units.
For example, 10.0 of 0.400 peroxide made up to 20.0 gives . A cubic centimetre equals a millilitre; . Thus , rather than 200 . The smaller volume unit contains fewer moles at the same concentration.
A serial dilution uses one well-mixed dilution to prepare the next. To make a twofold series, prepare labelled vessels with equal measured volumes of the same diluent. Transfer an equal volume of stock into the first, mix, transfer an equal volume of this mixture into the second, and continue. Each step halves concentration: stock, half-stock, quarter-stock, eighth-stock. Use a clean tip or clean dedicated pipette for each transfer, mix before withdrawing, and read volumes at eye level. An early error can propagate into all later vessels; independently prepared dilutions provide a useful check.
For the gas investigation, use fresh teacher-prepared catalase-containing potato extract as the enzyme stock. A suitable preparation is to homogenise 100 g peeled potato with 200 pH 7 buffer, strain through muslin and make the filtrate up to 300 with the same buffer. Retain one mixed batch: this provides enough stock for the dilutions and triplicate trials in both series, including controls. Its activity varies between potatoes, so call it 100% of this stock, not a measured molar concentration of pure catalase. Keep it cool until use, gently remix before taking aliquots and use it during one session. Diluting crude extract also dilutes other extract components; a purified preparation would isolate enzyme concentration more closely.
Make enough dilution for all trials. For example, place 40 buffer into each of three labelled vessels. Mix 40 stock with the first buffer portion to make 50% stock; transfer 40 of that mixture to the next to make 25%; repeat to make 12.5%. Retain a separate stock portion. This leaves at least 40 of each dilution, enough for three 10 trials with some spare. A buffer-only vessel supplies the zero-enzyme control.
The enzyme dilution is diluted again when it enters the reaction mixture:
| Enzyme aliquot, always 10.0 | Peroxide aliquot, always 10.0 | Enzyme in the 20.0 reaction | Starting peroxide in reaction / |
|---|---|---|---|
| 12.5% stock | 0.400 | 6.25% stock | 0.200 |
| 25.0% stock | 0.400 | 12.5% stock | 0.200 |
| 50.0% stock | 0.400 | 25.0% stock | 0.200 |
| 100% stock | 0.400 | 50.0% stock | 0.200 |
| Buffer only | 0.400 | 0% stock | 0.200 |
For the substrate series, serially dilute teacher-prepared 0.400 peroxide with the same buffer to 0.200, 0.100 and 0.0500 . Use the same transfer-and-mix method and sufficient volumes. Mix 10.0 of each with 10.0 undiluted enzyme stock. The final peroxide concentrations are 0.200, 0.100, 0.0500 and 0.0250 ; final enzyme concentration is always 50.0% stock. Replace peroxide with buffer for a zero-substrate control. Prepare both stocks and every diluent in the same compatible buffer so buffer concentration does not fall across the series; check the actual mixture pH.
Running two controlled series
Run one concentration series at a time so that the source of a rate difference is identifiable.
The following is a supervised laboratory adaptation of the gas-collection approach in Nuffield/Practical Biology and SSERC. It adds early time-course recording and an enclosed mixing start to investigate initial rates. The teacher pilots the extract activity and apparatus first: the fastest reaction must remain slow enough to resolve its start, and the total gas must stay comfortably within syringe capacity. These concentrations are a starting design, not a promise of particular measured rates.
Use a 100 gas syringe with a freely moving plunger, tubing and airtight bung; a wide-neck reaction flask with a small internal tipping vial that fits inside; suitable measured-volume pipettes or syringes; a thermostatic water bath, thermometer and pH meter or suitable pH paper; a timer and recording sheet, or a gas-volume sensor/data logger. The inner vial holds one reagent upright and apart from the other until the sealed flask is tilted. The teacher checks that the vial fits, can tip safely and does not block the gas outlet. This avoids losing the first oxygen while fitting a bung or creating a large gas displacement by injecting extra liquid into an already sealed vessel.
Procedure
- Label all solutions and record their stock identity, dilution and final reaction concentrations. Set a water bath to 25 °C. Check its temperature with a thermometer; equilibrate the measured enzyme and peroxide portions separately for five minutes. Check pH 7 in a spare mixed sample. If the teacher's pilot changes the stock activity or conditions, record the change and apply it consistently throughout both series.
- Secure the gas syringe horizontally with its plunger free to move and no clamp on the moving part. Check for leaks and plunger sticking using air before adding reagents. Never use a blocked delivery tube or a restrained plunger. Keep the gas apparatus at the same room temperature for all trials.
- For one enzyme-series condition, put 10.0 of the specified enzyme dilution in the reaction flask and 10.0 of 0.400 peroxide in the internal vial, without mixing them. Fit the bung and connect the gas syringe. Allow gas pressure and temperature to settle; record the initial syringe reading. Do not seal and then warm the headspace, which would expand trapped air and mimic oxygen production.
- Tilt to mix and start the timer at first contact. Mix promptly, then use the same gentle swirling pattern for every trial. Keep the reaction mixture at the controlled temperature, returning it to the bath after the brief mixing movement. Do not splash liquid into the gas line. Record the mixing duration and any visible delay before the syringe responds.
- Record oxygen volume at 0, 2, 5, 10, 20, 40, 60, 120, 180 and 300 seconds, subtracting the starting reading. A data logger collecting at least once per second makes early readings easier; manual work needs separate mixing/timing and reading/recording roles. The pilot determines whether still closer early readings are needed. Continue long enough to see the later curve, but stop before the syringe approaches its limit.
- Depressurise by disconnecting as directed by the teacher before emptying. Rinse the flask, vial and tubing as appropriate and use fresh measured reagents for every independent repeat. Obtain at least three complete time courses at each concentration and for the blank. Interleave concentrations or randomise their order so extract ageing or room-temperature drift is not confounded with concentration.
- Repeat the procedure for the substrate series, using 10.0 undiluted enzyme stock every time and 10.0 of each peroxide dilution. Include the zero-substrate blank. Calculate an initial tangent for each individual trial, then the mean initial rate for each concentration.
| Controlled feature | How and why it matters |
|---|---|
| Other reactant's starting concentration | Same peroxide for the enzyme series; same enzyme stock concentration for the substrate series. Otherwise two possible causes change together. |
| Total liquid volume and vessel/headspace | Always 20.0 in the same apparatus. This controls dilution, mixing geometry and the gas response. |
| Temperature | Same bath and equilibration time; record actual starting and ending temperature. Temperature affects catalysis, gas volume and possible enzyme denaturation. The reaction can release heat. |
| pH and buffer | Same suitable buffer concentration and measured pH. A changed pH may alter the active site and enzyme activity. |
| Enzyme source and age | Same mixed batch in one session. Crude extract composition and activity vary. |
| Mixing, start and readings | Same mixing and early sampling; prompt enclosed start. Delays selectively miss the fastest part. |
Wear eye protection and a lab coat, avoid skin/eye contact with peroxide and rinse splashes immediately according to the laboratory procedure. The teacher prepares dilute peroxide from concentrated stock and checks the current supplier information and centre risk assessment. Use small quantities, clean labelled bottles and fresh dilutions; never return contaminated liquid to the stock. Oxygen supports combustion, so keep flames away. Do not force a glass bung or allow pressure to build behind a blocked outlet. The teacher operates the blender/cutting equipment; wash hands after handling potato extract. Plant material avoids animal tissue and its additional hygiene/ethical concerns, while still requiring careful handling and disposal under local laboratory instructions.
Record dates, reagent batches, real volumes, pH, temperature, instrument resolution, raw time–volume readings and any mishaps as they occur. This is evidence for evaluating a method. Online calculations prepare you for practical work; only your centre can authenticate performed competence and the practical endorsement.
Reading product–time curves
A time-course graph separates how fast product forms from how much product has formed by a particular time.
The following original illustrative data show two designed patterns. They are smooth teaching models, not measurements made with the apparatus above and not a fitted law for potato catalase. Volumes are calculated and rounded to 0.01 to make the curves reproducible; this does not imply that a school gas syringe reads to that precision. Actual raw readings must match the instrument resolution.
Enzyme series: fixed starting peroxide
| Time / s | Oxygen / cm³, 6.25% enzyme stock | Oxygen / cm³, 12.5% enzyme stock | Oxygen / cm³, 25.0% enzyme stock | Oxygen / cm³, 50.0% enzyme stock |
|---|---|---|---|---|
| 0 | 0.00 | 0.00 | 0.00 | 0.00 |
| 2 | 0.12 | 0.24 | 0.48 | 0.95 |
| 5 | 0.30 | 0.60 | 1.19 | 2.34 |
| 10 | 0.60 | 1.19 | 2.34 | 4.57 |
| 20 | 1.19 | 2.34 | 4.57 | 8.70 |
| 40 | 2.34 | 4.57 | 8.70 | 15.82 |
| 60 | 3.47 | 6.69 | 12.44 | 21.66 |
| 120 | 6.69 | 12.44 | 21.66 | 33.54 |
| 180 | 9.67 | 17.39 | 28.48 | 40.07 |
| 300 | 15.01 | 25.33 | 37.29 | 45.61 |
Substrate series: fixed enzyme
| Time / s | Oxygen / cm³, 0.0250 mol dm⁻³ peroxide | Oxygen / cm³, 0.0500 mol dm⁻³ peroxide | Oxygen / cm³, 0.100 mol dm⁻³ peroxide | Oxygen / cm³, 0.200 mol dm⁻³ peroxide |
|---|---|---|---|---|
| 0 | 0.00 | 0.00 | 0.00 | 0.00 |
| 2 | 0.39 | 0.59 | 0.79 | 0.95 |
| 5 | 0.92 | 1.41 | 1.92 | 2.34 |
| 10 | 1.70 | 2.65 | 3.68 | 4.57 |
| 20 | 2.92 | 4.72 | 6.80 | 8.70 |
| 40 | 4.42 | 7.59 | 11.68 | 15.82 |
| 60 | 5.19 | 9.32 | 15.17 | 21.66 |
| 120 | 5.89 | 11.40 | 20.75 | 33.54 |
| 180 | 5.99 | 11.87 | 22.81 | 40.07 |
| 300 | 6.00 | 11.99 | 23.84 | 45.61 |
Put time, the independent recording variable, on the horizontal axis and oxygen volume on the vertical axis. Both are continuous quantities. Choose a numerical scale that fills most of the graph, with equal intervals representing equal increments; label quantities and units. Plot each coordinate accurately and use a key with different symbols/line styles. Fit smooth curves consistent with the readings rather than a bar chart, a forced straight line or repeated angular joins. Do not force real data through zero if a justified starting-volume correction has not been made. Use a more expanded early-time scale when drawing initial tangents.
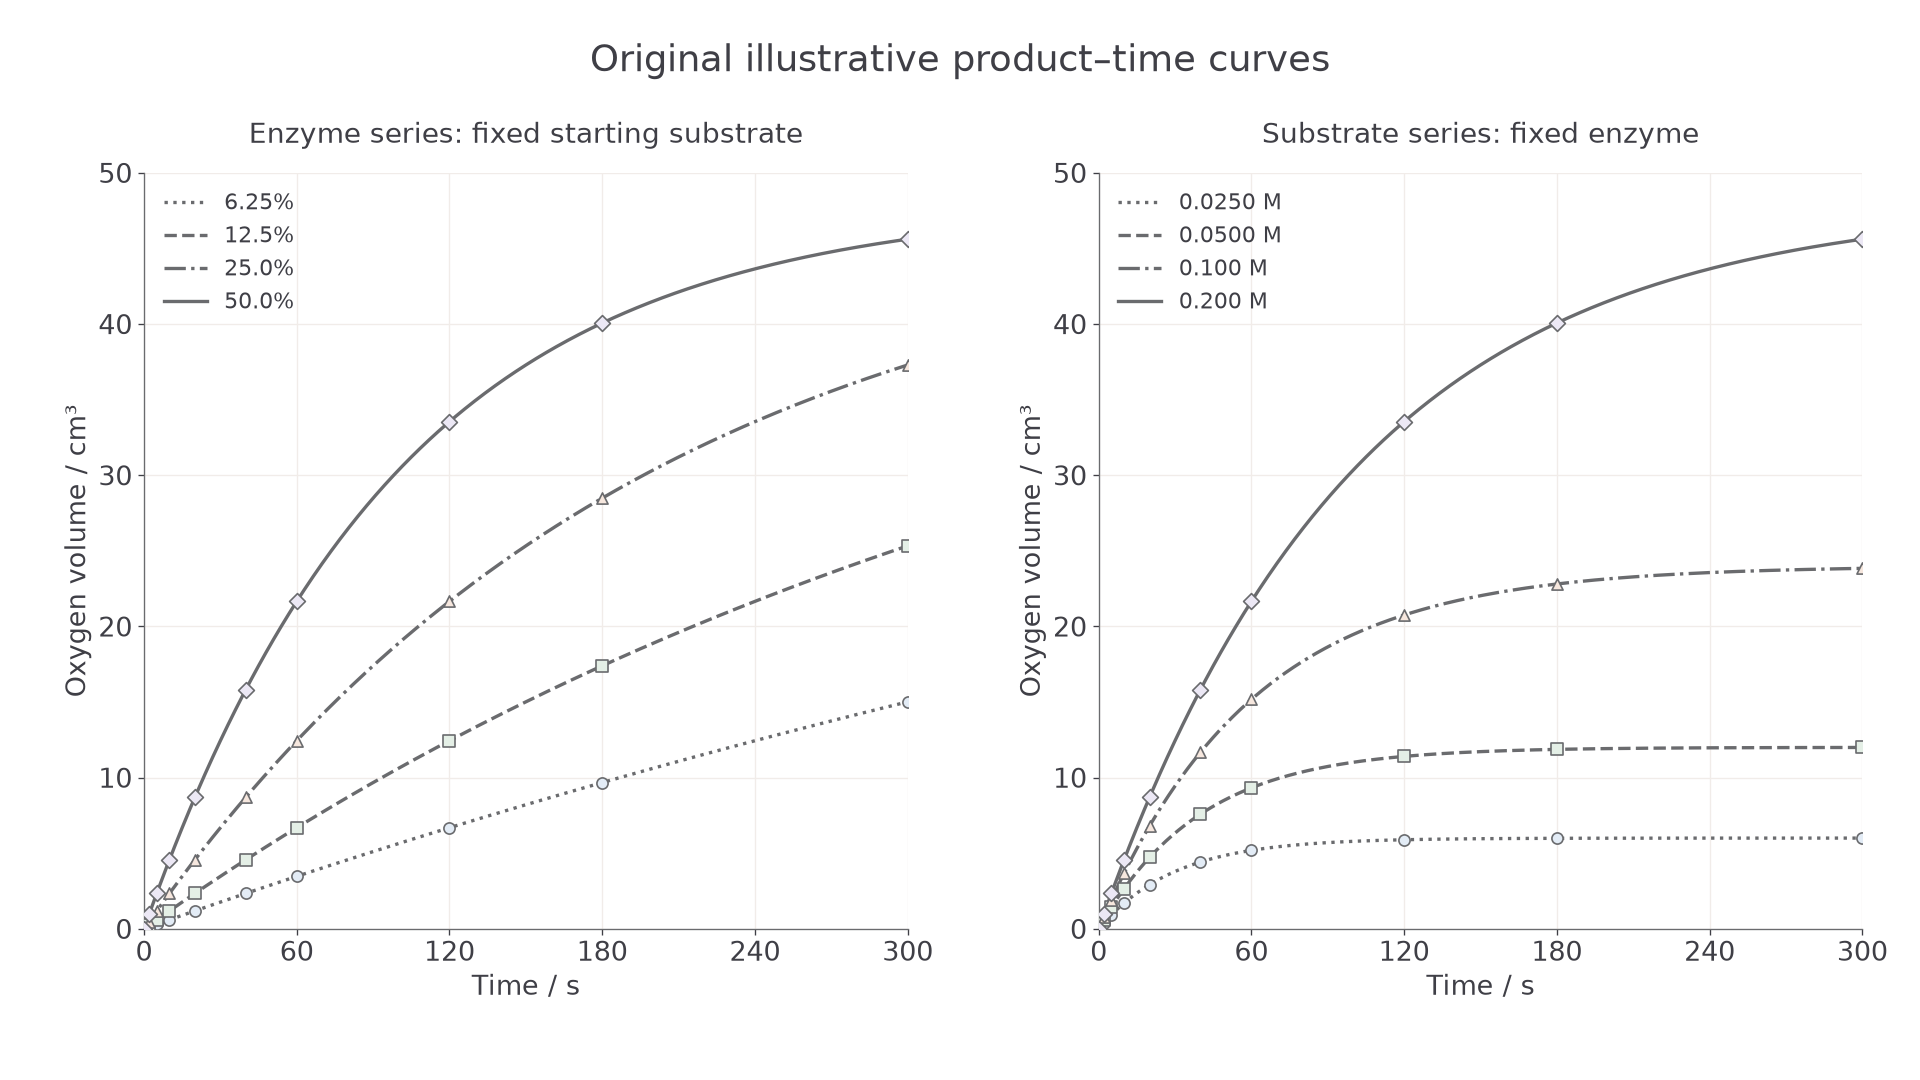
The enzyme curves have different starting slopes. The substrate curves also differ in eventual product supply; a flat product–time curve means almost no further product forms per second.
In the enzyme-series model, every curve would eventually approach 48 if followed long enough, because starting substrate amount is the same and the enzyme is not used up. The low-enzyme curves have not reached this final yield at 300 seconds. In the substrate series the model's eventual yields are 6, 12, 24 and 48 , reflecting the different substrate amounts at equal total volume. Real plateaux can also arise from loss of enzyme activity or apparatus problems; reaching a plateau alone does not identify its cause.
Keep data, calculations and graphs together in a spreadsheet: use one column for time and one per series, then an XY scatter chart with numerical axes. Retain raw data, document any baseline correction and do not let a default trendline turn a curved reaction into a linear one. A plotted point is a measurement/model value; a fitted line is an interpretation.
Drawing an initial tangent
The slope of a product–time curve at a particular instant gives the rate at that instant.
A tangent is a straight line with the curve's local direction at the selected point. For an initial rate, draw it at the actual mixing start, using the earliest well-resolved part of the smooth curve to judge its direction. Extend the line so two widely separated, readable coordinates can be chosen on the tangent, whether or not those coordinates are measured data points. Use a large slope triangle to reduce the relative effect of reading uncertainty. A line joining the start to a later point on a bending curve is a secant and gives an average over that interval.
Here is product gas volume in , is time in seconds and is initial oxygen-production rate in .
For the 25.0%-stock enzyme model, the initial tangent passes through and . First estimate: about 10 in 50 seconds suggests a few tenths of a cubic centimetre per second. Then calculate:
The point at 50 seconds and 12.0 lies on the extended tangent, not the product curve. At 60 seconds the curve gives 12.44 , so the average from 0 to 60 seconds is , lower than 0.24 because the reaction slows. Dividing a later curve volume by time does not recover the initial gradient.
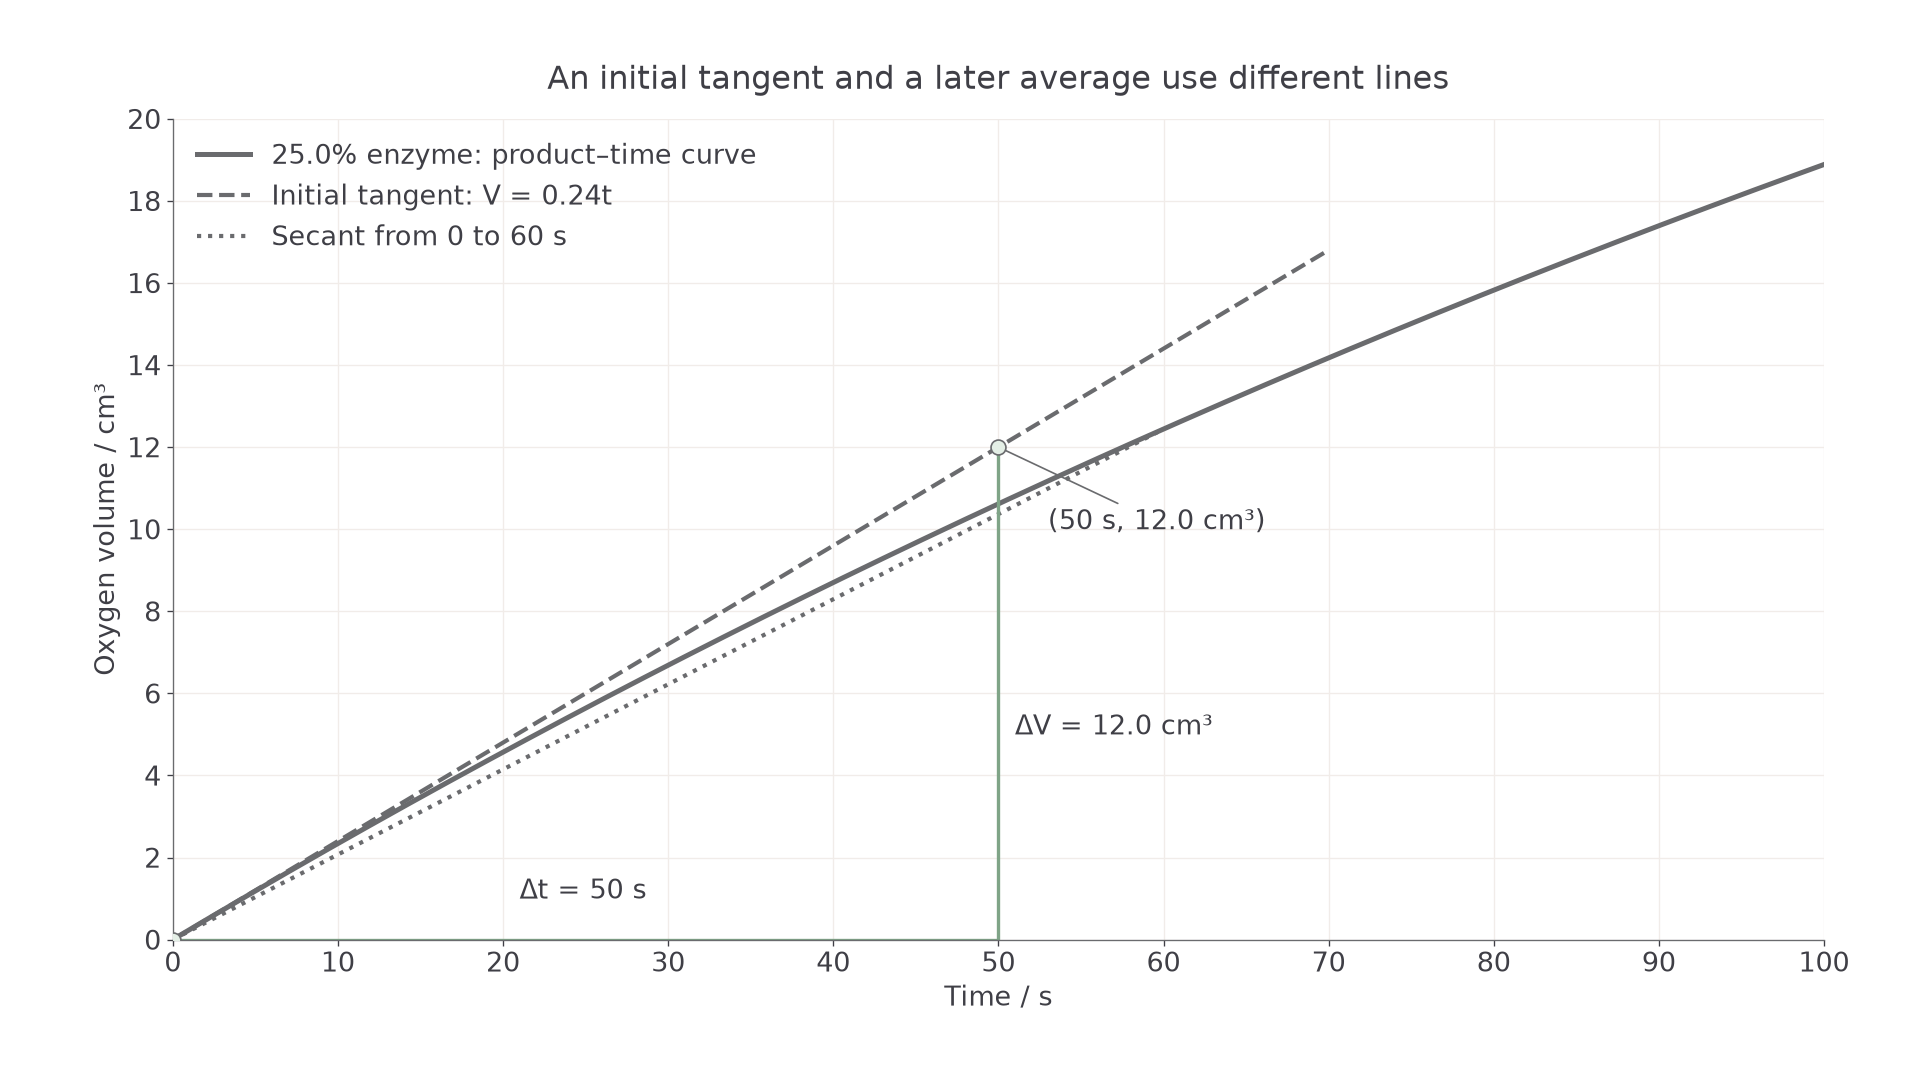
The dashed tangent has gradient 0.24 cm³ s⁻¹; the dotted secant gives the lower average rate over 60 seconds.
Report a precision supported by the tangent readings and apparatus. The calculator output 0.240000 does not add information: 0.24 has two significant figures. Keep extra digits during intermediate steps, then round the final reported value. Multiplying by 60 converts 0.24 to approximately 14 at two significant figures. A result of 240 would contradict both the graph scale and the estimate.
If mixing, transport through the gas line or sensor response hides the first part, a tangent to later readings is not automatically the true initial tangent. Reduce enzyme activity consistently, shorten the response delay or use a faster sensor and repeat. Record the missing interval rather than inventing a zero-time observation.
Replicates and combined uncertainty
Repeated time courses reveal variation, while measurement uncertainty limits how precisely a rate can be reported.
Calculate an initial tangent rate separately for each fresh reaction. For three rates of 0.22, 0.24 and 0.26 , the arithmetic mean is
The range is . Show individual values or clearly labelled range bars as well as the mean. More repeats improve the estimate of the mean and expose inconsistent trials; they do not remove a leak affecting every trial. Do not delete a value merely because it spoils the trend. Retain it, investigate a recorded cause such as a sticking syringe and repeat if justified; document any exclusion and report its effect.
Absolute uncertainty has the measurement's units; percentage uncertainty is absolute uncertainty divided by the measured magnitude, multiplied by 100. The following is a simple conservative calculation with stated reading bounds, not a statistical confidence interval.
Suppose each volume coordinate used on a tangent can be read to , and each time coordinate to . Subtracting two readings gives maximum absolute uncertainties that add:
For division, adding the percentage uncertainties gives an approximate conservative bound when they are small:
The absolute rate uncertainty is approximately . Retaining two significant figures in the uncertainty, report , with an approximately 5% reading uncertainty. The central value is written to the same decimal place as its uncertainty; its trailing zero does not claim absence of uncertainty. The calculation treats the stated bounds as able to combine in the worst direction and uses first-order percentage propagation. It is not the rule for combining standard deviations. It also excludes uncertainty in drawing the tangent, mixing delay, volume calibration and biological variation, which may be larger.
A wider tangent triangle reduces percentage reading uncertainty without changing its slope. It must remain on the same straight tangent. Increasing the actual averaging interval on a curved product trace is different: it changes the quantity measured and can bias the estimated initial rate downward. Dilution volumes also have uncertainty, and serial transfers can carry early concentration errors into later dilutions. Use appropriately precise measured-volume apparatus and check the most dilute solutions independently when possible.
Concentration and active-site availability
The two concentration series change different aspects of enzyme–substrate encounters, so their rate graphs need not have the same shape.
The initial tangents of the illustrative time curves give these rates. The zero entries describe the model's blank; an actual blank must be measured rather than assumed to be zero.
| Final enzyme concentration / % of stock | Initial rate / cm³ s⁻¹, fixed starting substrate |
|---|---|
| 0 | 0.00 |
| 6.25 | 0.06 |
| 12.5 | 0.12 |
| 25.0 | 0.24 |
| 50.0 | 0.48 |
| Final peroxide concentration / mol dm⁻³ | Initial rate / cm³ s⁻¹, fixed enzyme |
|---|---|
| 0 | 0.00 |
| 0.0250 | 0.20 |
| 0.0500 | 0.30 |
| 0.100 | 0.40 |
| 0.200 | 0.48 |
Plot concentration on the horizontal axis and mean initial rate on the vertical axis. Use an XY graph, label the concentration convention explicitly and include variation bars when you have replicates. A concentration–rate graph is a second graph, made from the slopes of the time-course graphs. Its slope is a change in rate per change in concentration, not the oxygen-production rate itself.
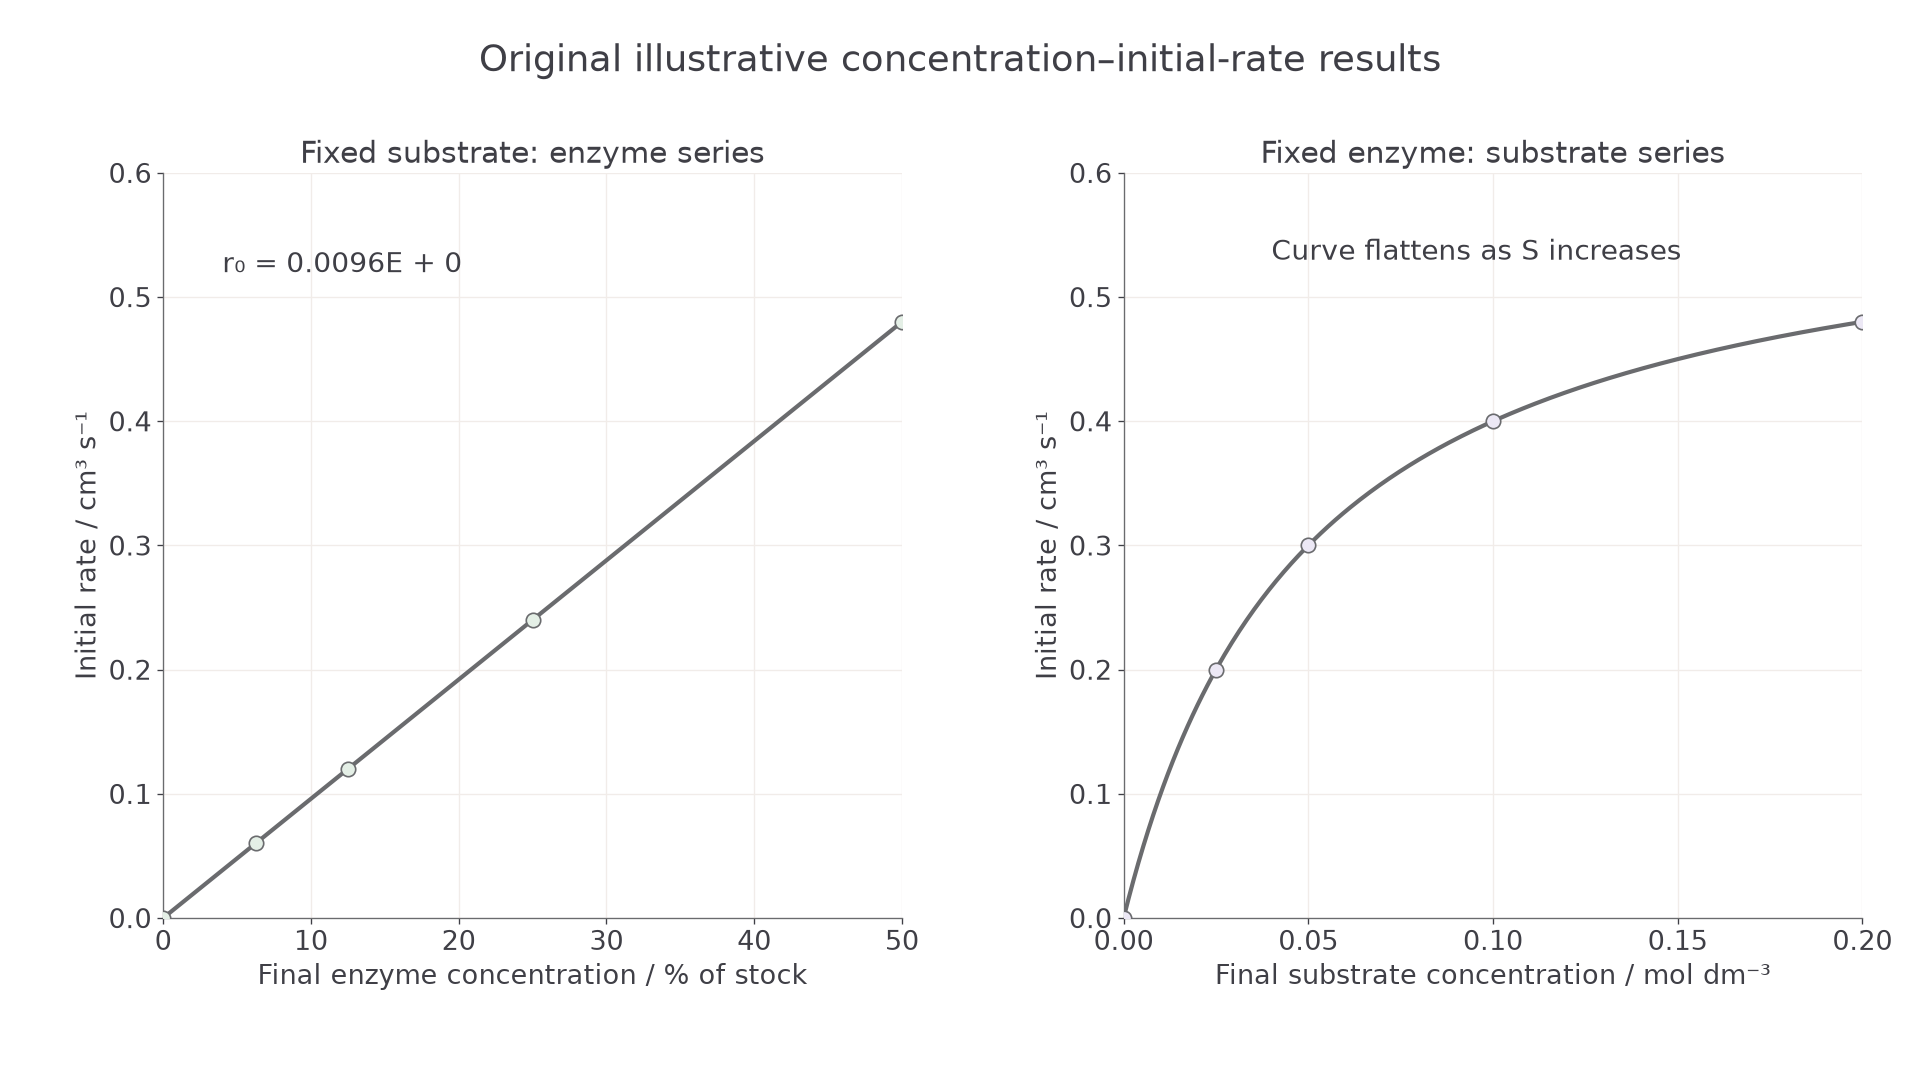
These original model patterns distinguish proportional enzyme effects over a stated range from a substrate response approaching saturation.
At fixed substrate concentration and controlled conditions, more active enzyme molecules provide more active sites. If substrate remains sufficiently available during the resolved initial interval and mixing/detection do not limit the measurement, more enzyme–substrate complexes can be processed per second. In the enzyme model, doubling enzyme doubles the initial rate. This proportionality is conditional; severe substrate depletion during mixing, an insufficient substrate supply relative to the enzyme or a limited instrument response can spoil it.
At fixed enzyme concentration, increasing substrate concentration initially increases encounters with unoccupied active sites. The initial rate rises. At high substrate concentration, a larger proportion of sites is occupied and enzyme turnover increasingly limits the rate. More substrate then makes progressively less difference: the rate approaches a maximum for that enzyme concentration and those conditions. Saturation refers to this concentration–initial-rate relationship, not to the later flattening of a single product–time curve through substrate depletion.
In the supplied substrate model, doubling peroxide from 0.100 to 0.200 increases rate only from 0.40 to 0.48 , not to 0.80. Do not force a straight line through this saturating pattern or claim that a true maximum has been measured from its last point. Real catalase data may not reach a clear plateau over the safe accessible range. Report that limit; do not invent missing saturation data.
Linear relationships and proportionality
A straight line has a constant gradient, but it represents direct proportionality only if its intercept is zero.
is the constant gradient , and is the value of when . A directly proportional relationship has : .
For the enzyme-series model, let be the numerical enzyme concentration in percent of stock and the initial rate in . Its line is . The gradient is per percentage point of stock. At , the interpolated rate is , or about 0.19 at two significant figures. This is a prediction within the illustrated range; extrapolating indefinitely assumes the same conditions continue to hold.
A low-substrate range can also be approximately proportional when enzyme is in sufficient excess that its turnover capacity is not limiting and many sites remain available. A separate original idealised example, using a different enzyme supply from the earlier substrate series, has and . The line is , where . This restricted model does not justify extending the line into the saturation region.
A straight product–time trace has a different interpretation. For the separate idealised trace below, points (0 s, 0 cm³), (5 s, 1.0 cm³), (10 s, 2.0 cm³) and (15 s, 3.0 cm³) lie on a straight line. Its rate is . Here substrate depletion is assumed negligible during the 15-second window. The line's gradient is directly a rate because its axes are product and time. Once such a trace bends, use the local tangent instead.
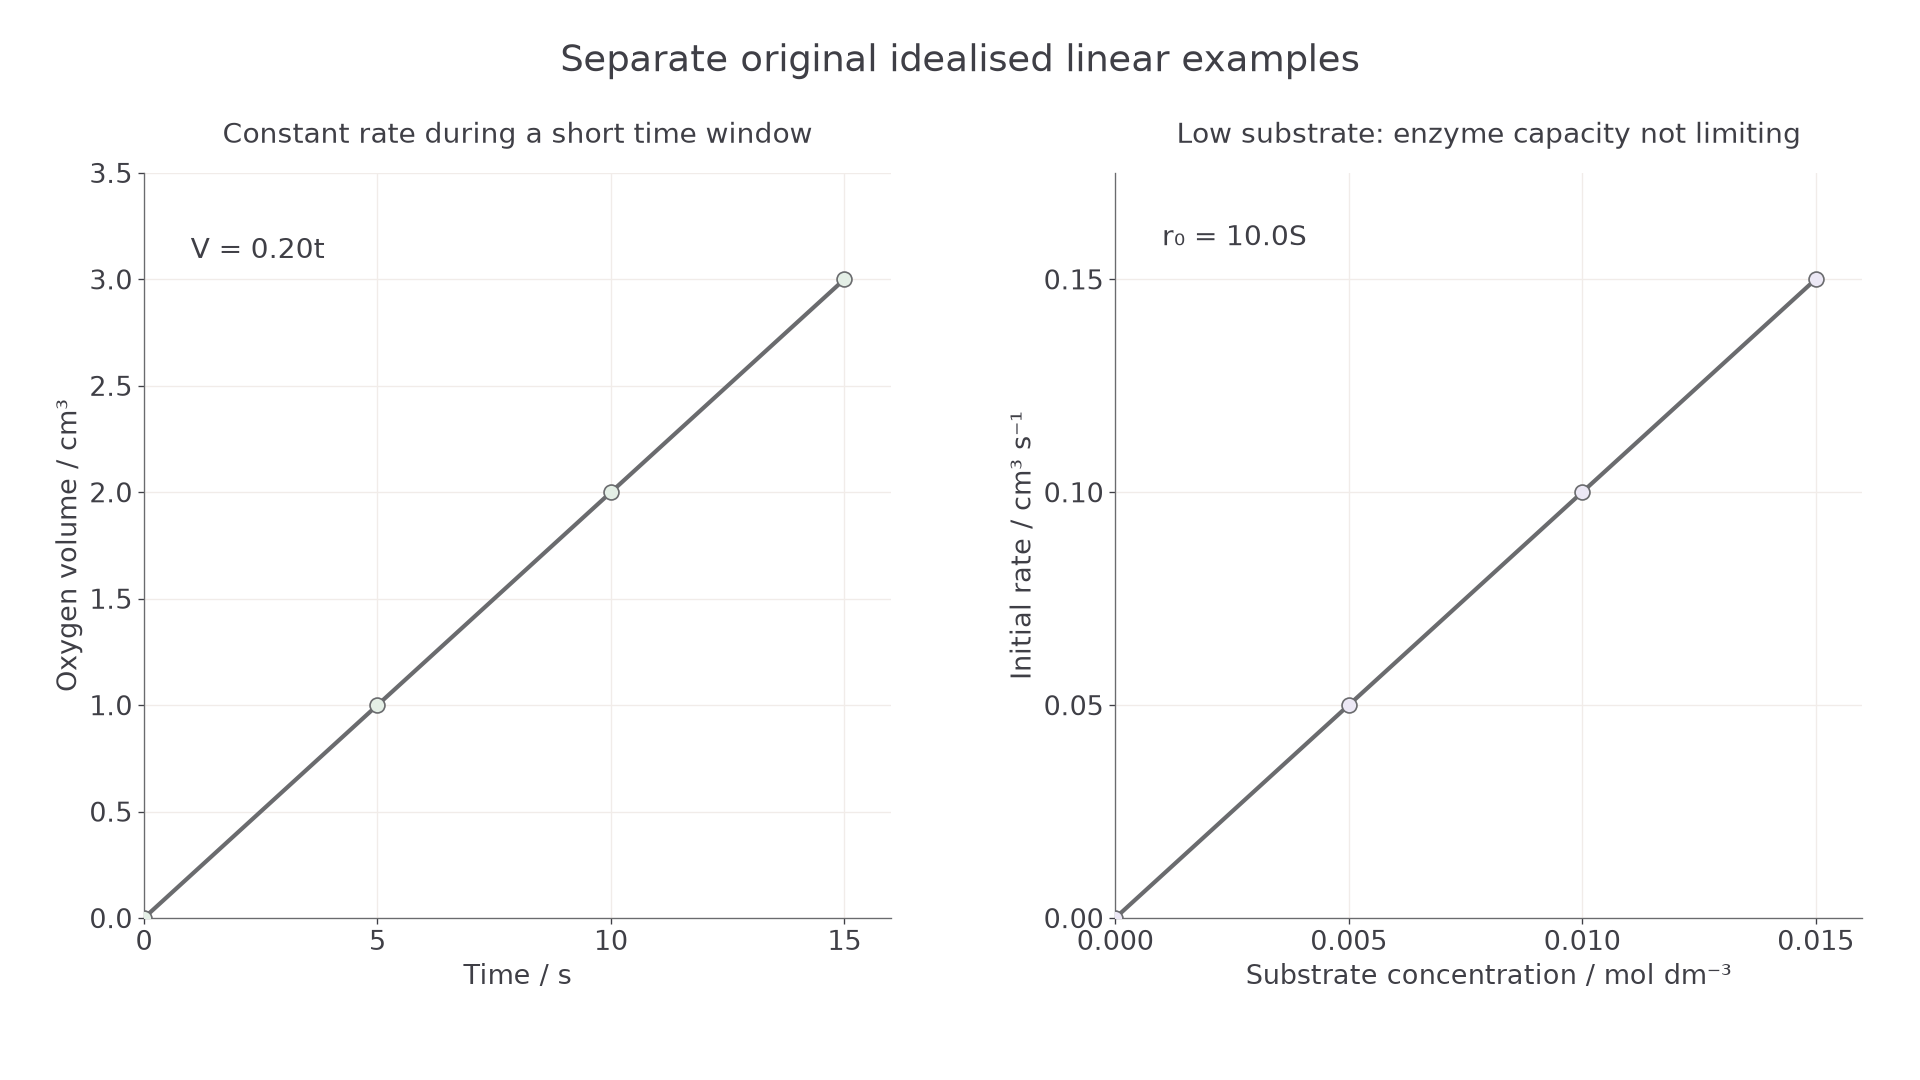
The left gradient is a product-formation rate. The right gradient is a change in initial rate per unit concentration; the two slopes have different units.
Read mathematical symbols as biological statements. asserts equality in the stated units; means less than and means greater than. A delay of 0.2 s is much less than a 40 s reaction timescale, written ; conversely . The symbols and express a scale comparison, not a universal numerical cutoff. says the ratio is constant under stated conditions, whereas indicates an approximation. Equal, approximately equal and proportional do not mean the same thing.
If a measured concentration–rate line has a positive intercept, investigate background reaction or a measurement offset. A line , for example, predicts 0.120 at and 0.220 at , in . Doubling concentration does not double the uncorrected rate. Subtract a blank only when its measured behaviour justifies that correction; do not force an intercept to zero to obtain the expected result.
Evaluating the evidence
A defensible conclusion describes the measured relationship, connects it to enzyme action and states the limits of the comparison.
For the illustrative enzyme series, increasing final enzyme concentration from 12.5% to 25.0% stock doubles initial rate from 0.12 to 0.24 . That supports proportionality within the tested range and conditions, consistent with more active sites processing substrate. It does not show that every enzyme behaves proportionally at every concentration. For the substrate series, an eightfold increase from 0.0250 to 0.200 raises initial rate only 2.4-fold, from 0.20 to 0.48 , consistent with an approach to enzyme saturation. It is not evidence for a falling rate at higher substrate concentrations.
Repeatability means obtaining similar results with the same method under the same conditions. Precision concerns small spread/uncertainty. Accuracy concerns closeness to the true value, and validity concerns whether the method answers the intended question. Closely agreeing replicates can all be too low if gas leaks. A very precise five-minute average still fails to measure an initial rate if the curve bends substantially.
| Evidence of a problem | Consequence and useful response |
|---|---|
| Syringe repeatedly sticks then jumps | Early slope is distorted. Check free movement, alignment and a suitable syringe/sensor before repeating; more identical trials do not fix the mechanism. |
| Reaction begins while the bung is being fitted | The first product is lost and the earliest time is missing. Use a validated enclosed start or make the reaction slow enough to resolve it. |
| Temperature drifts or rises more in fast trials | Both catalysis and gas volume may change. Check actual mixture temperature and improve bath control. |
| Blank produces appreciable gas | Some production is not due to active added enzyme, or there is a physical baseline change. Investigate it and justify any correction. |
| Crude extract settles or ages | Aliquots may differ in active enzyme content. Remix, use one fresh batch and interleave concentrations. |
| Mean rates differ slightly but variation is large | The direction or size of the effect may be uncertain. Show the spread, improve the method and obtain more independent trials. A graph alone does not establish statistical significance. |
Choose improvements that address the identified cause. More repeats reduce the influence of random variation on a mean; better volume apparatus reduces dilution uncertainty; a faster detector reduces missing early data. Neither averaging nor a smooth computer curve can correct an unknown systematic error. Do not infer confidence intervals or a significance test from the conservative uncertainty calculation above.
When reporting, preserve the raw records and original graph, state how tangents and means were obtained, label any range bars, give units and supported precision, and identify the practical sources used. This makes the conclusion checkable and separates observations from an explanatory model.
Change enzyme concentration and substrate concentration in separate controlled series. Measure each reaction's start, derive each initial rate from its own time trace, then compare replicated rates against concentration. A later yield, an endpoint reciprocal and an initial tangent answer different questions.