1.16 - Reducing coronary heart disease risk
Scientific evidence connects diet, physical activity and smoking with changes in coronary heart disease risk. Learn how these changes act, how to calculate two body-measurement indicators, and why neither an indicator nor a study result predicts an individual's future with certainty.
Modifiable risk pathways
Reducing coronary heart disease risk means reducing the probability of disease, rather than guaranteeing that disease will never occur.
Coronary heart disease
Disease in which the blood supply to the heart muscle is impaired, commonly because atherosclerotic plaques narrow the coronary arteries.
The coronary arteries supply oxygenated blood to the heart muscle. In atherosclerosis, dysfunction of the artery's inner lining and inflammation contribute to the formation of plaques containing lipids and other material within its wall. A plaque narrows the lumen. If a plaque ruptures, a blood clot can form at its surface and severely restrict or block the blood supply. Less oxygen reaches heart muscle; a prolonged interruption can kill muscle cells in a heart attack.
Prevention therefore acts at several connected stages: limiting plaque development, reducing damaging pressure on artery walls, and reducing the likelihood of clot formation. The useful question is not simply “Does this behaviour change body mass?” but “Which disease pathway can it change?”
Diet, activity and exposure to tobacco smoke are modifiable risk factors: their effects can be influenced. Age and inherited susceptibility also contribute. Factors can interact, so a person who is physically active may still have substantial risk from smoking or high LDL cholesterol. Access to food, safe activity and support also affects what changes people can make. Risk indicators describe biology and evidence; they do not measure a person's character or effort.
Diet and coronary risk
Food can influence coronary risk through energy balance, blood lipids and blood pressure.
A sustained excess of energy intake over expenditure can increase stored fat. Excess adipose tissue is associated with raised blood pressure and disturbances of glucose and lipid regulation, which can contribute to cardiovascular risk. This does not mean that every increase in mass is an increase in fat: muscle, bone and fluid also contribute to mass.
Dietary fat composition matters as well as total energy. Replacing some saturated fat with unsaturated fat can lower LDL cholesterol. LDL particles carry cholesterol in the blood; higher LDL cholesterol promotes the development of atherosclerosis. For example, replacing some butter with an appropriate unsaturated vegetable oil changes the fatty-acid mixture. Adding oil without replacing another energy source can instead increase total energy intake. A “low-fat” label alone does not establish the effect of the whole diet. Foods such as oats and beans supply soluble fibre, which can help lower LDL cholesterol. These are examples of biological pathways, not a prescribed diet for an individual. NHLBI's cholesterol resource
Reducing a high intake of sodium from salt can lower blood pressure. Lower sustained pressure reduces mechanical stress on artery walls and helps reduce coronary risk. Fruit, vegetables, whole grains and other foods contribute to a dietary pattern; no single food guarantees prevention. NHLBI's food guidance
There is experimental evidence for effects of dietary patterns. In the randomised DASH trial, 459 adults received controlled diets for eight weeks. Body mass, sodium intake and physical activity were kept stable. The combination diet, rich in fruit, vegetables and low-fat dairy products and lower in saturated and total fat, lowered systolic blood pressure by an average of 5.5 mmHg more than the control diet. Random allocation and controls strengthen the inference that the dietary pattern caused the blood-pressure difference. Several components changed together, so the result does not identify one food as the sole cause. The measured outcome was blood pressure, not the number of subsequent heart attacks. NHLBI's DASH study record
Physical activity pathways
Regular physical activity can reduce coronary risk through several physiological changes, including changes that occur without a large reduction in body mass.
Activity increases energy expenditure. When intake does not rise by an equal amount, this can help prevent a sustained energy surplus. Regular activity can also improve glucose regulation and help lower long-term resting blood pressure. Lower resting pressure reduces stress on artery walls. Activity can improve the blood-lipid profile, although the response varies between people. A higher HDL cholesterol value on its own is not proof that one intervention has reduced heart attacks; the whole outcome and supporting evidence matter. NHLBI's activity overview
During an individual exercise session, heart rate and oxygen demand rise so that active muscles receive more oxygen. That short-term response is compatible with a long-term reduction in resting cardiovascular risk factors. It is a mistake to interpret the temporary rise in heart rate as evidence that all activity causes coronary disease, or to suggest that exercise “flushes plaques out” of an artery.
Different studies answer different questions. A training study can measure a change in blood pressure or fitness; a long-term cohort can compare disease occurrence in people with different activity patterns. People who choose to be active may also differ in smoking, diet or pre-existing illness. Observational comparisons need those differences considered before assigning the entire disease difference to exercise. Population evidence informs prevention; the suitable type and amount of activity for a particular person depend on their circumstances.
Smoking and coronary supply
Cigarette smoke affects both the heart's oxygen requirements and the processes that deliver oxygen to it.
Nicotine stimulates responses that increase heart rate and blood pressure. The heart does more work and its muscle requires more oxygen. Carbon monoxide binds to haemoglobin, leaving less haemoglobin available to carry oxygen. Together, increased demand and reduced oxygen-carrying capacity can worsen the mismatch between oxygen supply and demand, especially when coronary arteries are already narrowed. CDC's heart disease risk factors
Other components of smoke damage the cells lining blood vessels and promote plaque development. Smoking also increases the tendency of blood to clot. A clot at a disrupted plaque can block a coronary artery, so smoking affects the probability of an acute obstruction as well as long-term plaque formation. It is not accurate to attribute every harmful effect of cigarette smoke to nicotine alone. CDC's cardiovascular evidence summary
Stopping smoking removes repeated smoke exposure. Compared with continuing to smoke, coronary disease risk decreases after cessation and generally continues to decrease over time. Avoiding secondhand smoke also reduces exposure to harmful smoke components. Existing plaques and other risk factors do not disappear immediately, so cessation does not instantly make risk zero. The conclusion that tobacco smoke causes cardiovascular harm rests on converging biological and population evidence, rather than one unadjusted comparison. NHLBI's coronary disease overview
BMI calculation and limits
Body mass index compares mass with height using a standard calculation, but does not directly measure body fat.
Here is body mass index (BMI) in , is mass in kilograms and is height in metres.
The square applies to height, not mass. Convert grams to kilograms and centimetres to metres before substitution. If height is entered in centimetres in the metre-based formula, the denominator is numerically 10,000 times too large and the calculated BMI is 10,000 times too small.
For an invented adult record, mass is and height is . Convert to and :
Reported to three significant figures, this is . A result of from these records would signal a unit error, not a biological discovery.
Solving for an unknown measurement
If height and BMI are given, multiply both sides by :
For and ,
The metre-squared factors cancel, leaving kilograms. This is an algebra exercise using supplied records, not a target mass for a person.
If mass and BMI are known, first isolate , then take its square root:
For and , , so . Height must be positive. Check by substitution: . Dividing mass by BMI without taking the square root gives height squared, not height.
Interpreting the indicator
Conventional adult screening bands include BMI below 18.5, 18.5 to below 25, 25 to below 30, and 30 or above, often labelled underweight, healthy weight, overweight and obesity respectively. These bands summarise population patterns; they are not boundaries at which coronary disease suddenly begins. BMI cannot distinguish muscle from fat or locate fat within the body. An adult with a large muscle mass can have a high BMI without excess fat. CDC's BMI explanation, adult screening bands
Age and population background affect interpretation, and some groups have increased cardiometabolic risk at lower BMI. Children and adolescents require age-related interpretation rather than simple use of adult bands. Blood pressure, lipid measurements, smoking and family history add information that BMI lacks. Even the conventional “healthy weight” category cannot rule out central fat accumulation or coronary disease. NICE's assessment guidance
Waist-to-hip ratio
Waist-to-hip ratio adds information about body shape that a mass-to-height calculation cannot supply.
Here is waist-to-hip ratio, is waist circumference and is hip circumference. Use the same length unit for both circumferences; the units cancel.
For invented measurements and , first convert to . Then . Equivalently, . Waist circumference is 90.0% of hip circumference in this record. The ratio is not 90% body fat, and it has no unit such as centimetres.
For an unknown waist circumference, . If and , . For an unknown hip circumference, . If and , . Substitution into the original ratio checks both results. Multiplying the waist by the ratio would not give the hip circumference.
Comparing two indicators
The following records are invented for learning. They do not describe particular students or a measured study.
| Adult record | Mass / kg | Height / cm | Waist / cm | Hip / cm | BMI / | Waist-to-hip ratio |
|---|---|---|---|---|---|---|
| P | 64.0 | 160 | 80.0 | 100 | 25.0 | 0.800 |
| Q | 81.0 | 180 | 95.0 | 100 | 25.0 | 0.950 |
P has BMI , and Q has BMI . Their ratios differ: and .
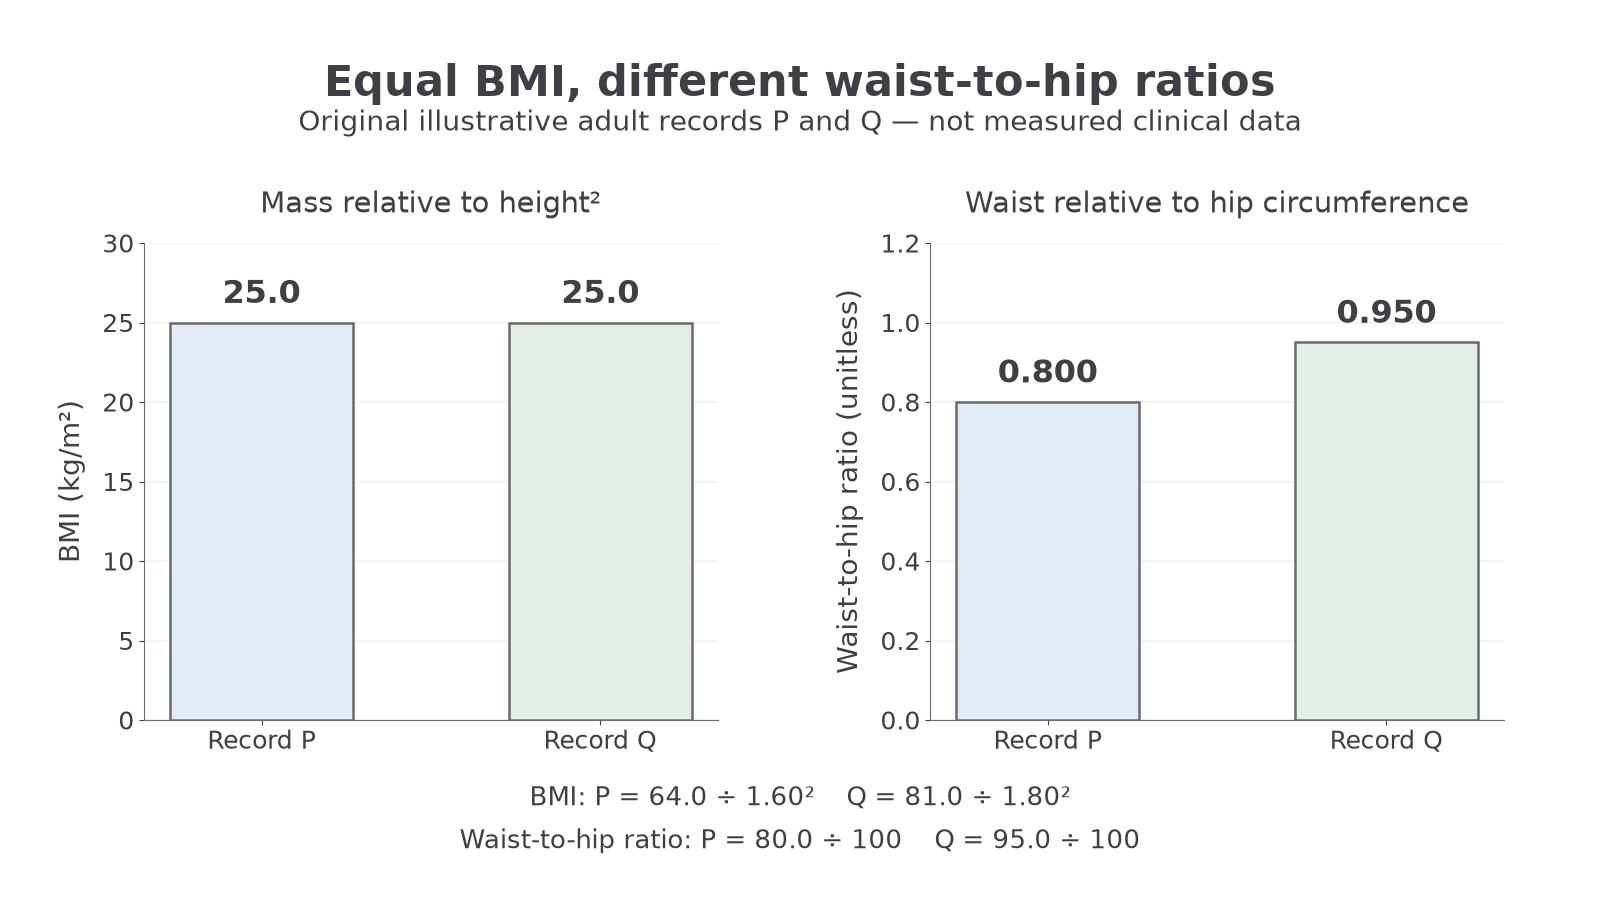
The separate panels use different units and scales: equal BMI does not imply equal waist-to-hip ratio.
A higher ratio indicates a larger waist relative to hip circumference. It can indicate more central adiposity, meaning fat accumulation around the abdomen, including fat around internal organs. Central adiposity is associated with cardiometabolic risk. However, the ratio does not directly measure internal fat: a change in hip circumference also changes the ratio. It cannot establish Q's total fat mass or diagnose coronary disease. Interpretation and suitable reference values vary with sex, age and population. WHO's indicator report
Measurements need a consistent protocol to make comparisons meaningful. A WHO protocol locates the waist midway between the lowest palpable rib and the top of the hip bone; hip circumference is measured at the widest part of the buttocks. A horizontal, non-stretch tape should be snug without compressing tissue, and waist readings are taken at the end of a normal breath out. Changing the position or tape tension can create an apparent difference that is a measurement artefact. Study measurements require consent and privacy; the calculations here use supplied records. WHO STEPS measurement manual
BMI and waist-to-hip ratio are useful indicators with different limitations. Neither is a direct measurement of body fat, a coronary disease diagnosis, or a substitute for the other risk information.
Use the supplied reference information when interpreting a study's classification. Do not apply one group's threshold universally or confuse waist-to-hip ratio with waist-to-height ratio.
Using prevention evidence
People use evidence most effectively when they distinguish a measured association, a plausible mechanism and an experimentally established effect.
Consider this complete original practice source, with invented data rather than a real clinical estimate: researchers followed two groups of 1000 adults for five years. The adults chose their existing activity patterns; researchers did not allocate them to exercise. There were 80 new coronary disease cases in the less-active group and 50 in the more-active group. The groups differed in age and smoking as well as activity.
| Group | Adults followed | New coronary disease cases in five years | Five-year proportion with disease |
|---|---|---|---|
| Less active | 1000 | 80 | |
| More active | 1000 | 50 |
The observed absolute difference is percentage points, equivalent to 30 fewer cases per 1000 adults. Relative to the less-active group's proportion, the relative difference is
The denominator defines the comparison: 37.5% is a fraction of the original 8.0% risk, not 37.5 fewer cases per 100 people. Both summaries describe the same data.
The source supports an association between greater activity and lower disease occurrence. It does not establish that activity alone caused the difference: age and smoking are confounding factors that can influence disease occurrence and differ between the groups. People with existing illness might also be less able to exercise, creating reverse causation. A larger sample improves the information available but does not automatically remove these design problems. The actual measurement and design set the conclusion's limits.
This limitation does not erase the other evidence for prevention. Mechanisms explain how smoke harms oxygen delivery and coronary arteries; controlled dietary trials test effects on risk factors; longer-term population evidence tests how patterns relate to disease. Agreement across different methods strengthens confidence. When a study measures blood pressure rather than coronary events, or estimates fat distribution rather than measuring it directly, that distinction should remain visible in the conclusion.
Evidence supports reducing tobacco-smoke exposure, improving dietary patterns and being physically active as ways to reduce coronary risk. The benefit is probabilistic, multiple pathways matter, and an individual's risk cannot be read from BMI or waist-to-hip ratio alone.