2.3 - Osmosis and free water molecules
Water can cross a cell membrane even when some dissolved substances cannot. This lesson explains how a difference in free-water concentration produces a net movement of water, why cells may swell or shrink, and how percentage mass change helps us interpret osmosis.
Free water and selective permeability
A solution contains a dissolved solute in a solvent; in cells, the solvent is water.
For the same solute, a dilute solution contains less solute per unit volume than a concentrated solution. Comparing concentration is different from comparing the total amount of water: a large container can hold more water overall but still contain the more concentrated solution.
Free water molecules
Water molecules available to move independently, rather than associated with dissolved solute particles at that moment.
Dissolved ions and polar molecules interact with water. In the free-water model used here, adding solute lowers the concentration of free water available for movement. Pure water has the highest free-water concentration; a more concentrated solution of the same solute has a lower free-water concentration than a more dilute one. Water–solute associations continually change. A particular water molecule is not permanently trapped, and the explanation does not require all solutes to repel water.
A partially permeable membrane allows some substances to pass through more readily than others. For a simple osmosis comparison, assume that water can cross but the named solute cannot. The solute remains on its side of the membrane while water can be exchanged. Actual cell membranes have different permeabilities to different substances, so check which particles a question says can cross.
Consider two equal volumes of sucrose solution separated by a membrane permeable to water but not sucrose. The more concentrated sucrose solution has the lower free-water concentration. The sucrose cannot move across to remove this difference; water is the moving substance. The next part explains its net direction. We will compare solutions at the same temperature, without an imposed pressure difference; water-potential calculations are not needed.
Net movement and dynamic equilibrium
Water molecules move continually and randomly, so molecules cross a suitable membrane in both directions.
Osmosis
The net movement of free water molecules through a partially permeable membrane from a region of higher free-water concentration to a region of lower free-water concentration.
Net movement is the difference between movement in the two directions. Under the comparison conditions above, more water crosses from the side with higher free-water concentration to the side with lower free-water concentration than crosses back during the same time. The overall transfer is therefore towards the more concentrated solution, although individual water molecules also cross the other way. Osmosis does not require a cell to use ATP to pump water.
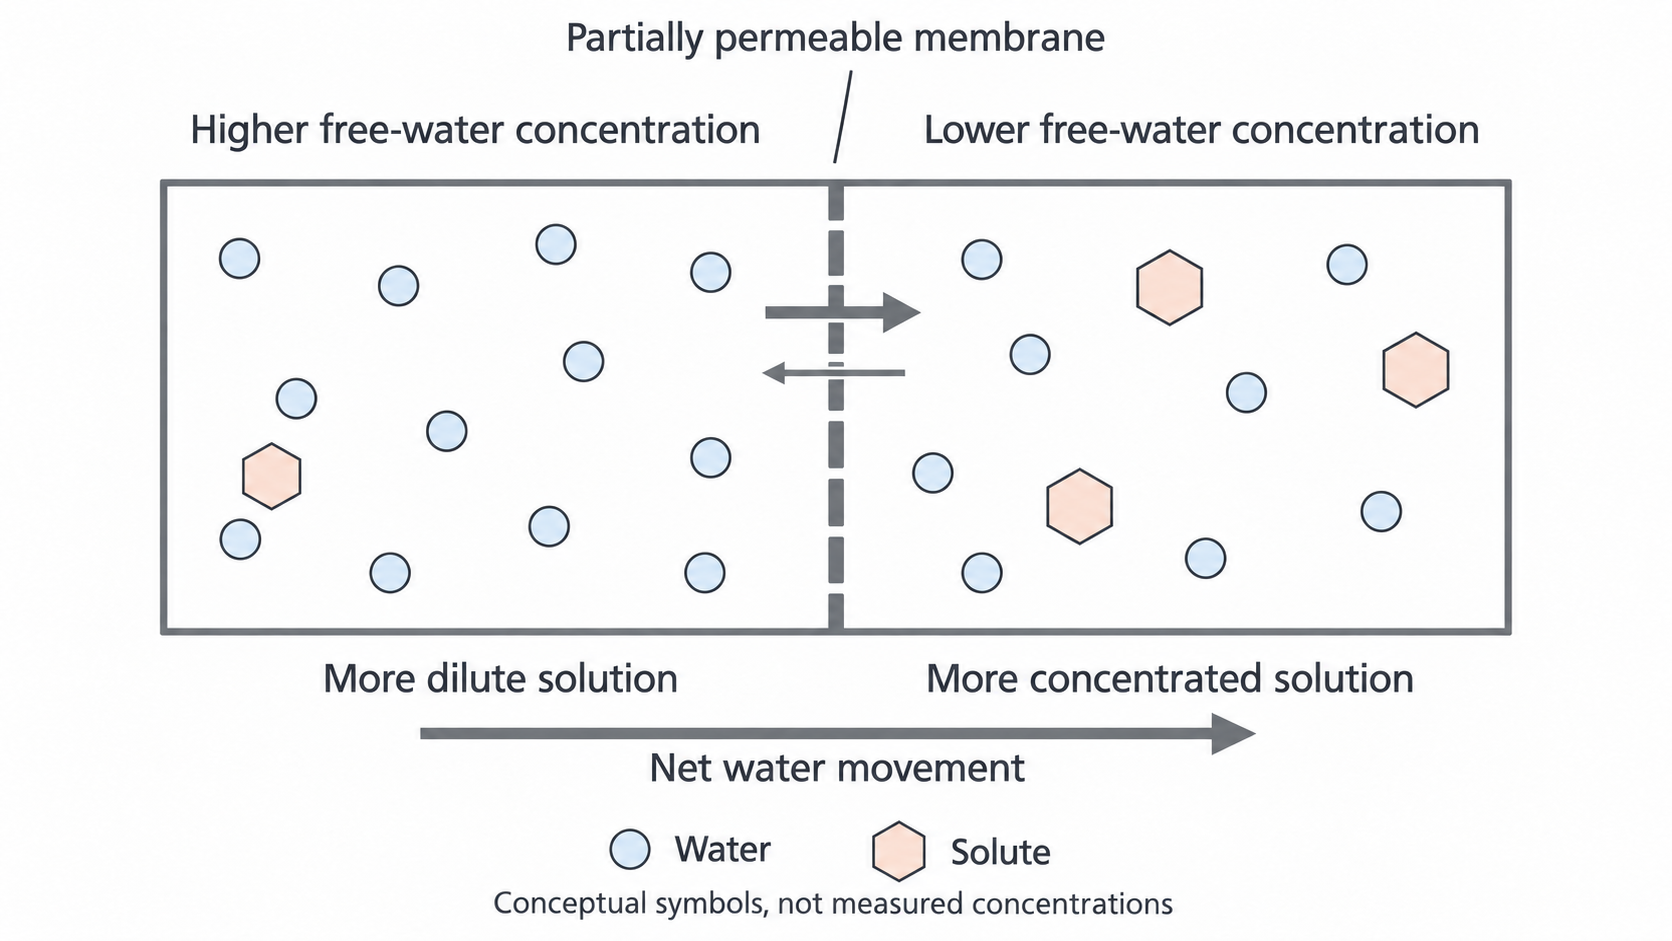
Water crosses in both directions, but the larger rightward arrow represents the greater transfer towards the lower free-water concentration. The particles and arrow widths are conceptual symbols, not measured concentrations or rates.
If water enters a flexible membrane bag containing a concentrated solution, the bag gains water and its contents become more dilute. If water leaves a solution, the remaining solution becomes more concentrated. These changes can reduce the difference between the two sides. In a simple system without an opposing pressure difference, equal free-water concentrations produce no net movement: the average transfers in both directions are equal. This is dynamic equilibrium. “Dynamic” means movement continues; equilibrium does not mean that water molecules stop.
A membrane bag can therefore remain the same mass while water continually enters and leaves it. Mass records the net change, not the movement of every molecule. Pressure can also oppose water entry, as the plant-cell wall will demonstrate; do not assume that every real system must reach equal solute concentrations.
Water movement and cell shape
The effect of osmosis on a cell depends on its surroundings and on whether a cell wall limits expansion.
An animal cell has a partially permeable cell-surface membrane but no cell wall. If its surroundings have a higher free-water concentration than its cytoplasm, water enters by osmosis. The cell swells and may lyse: its membrane ruptures if the increase is too great. In surroundings with lower free-water concentration, it loses water and shrinks. A red blood cell can develop a wrinkled outline as it shrinks; this is called crenation. When there is no net movement, its volume remains approximately steady, while water still crosses both ways.
A plant cell has a cell-surface membrane inside a strong cellulose wall. Its large vacuole is also bounded by a partially permeable membrane. As water enters, the vacuole and cell contents expand, pushing against the wall. The wall resists expansion and develops an opposing pressure. The cell becomes turgid, meaning firm from this internal pressure. The wall normally prevents the bursting that can happen in an animal cell; it does not prevent water reaching the cell membrane. A cell can stop gaining water because this pressure opposes further entry, even though a concentration difference remains.
When a plant cell loses water, the vacuole and cytoplasm decrease in volume and pressure against the wall falls. The cell becomes flaccid, or less firm. With sufficiently large water loss, the cell-surface membrane pulls away from the wall: plasmolysis. The rigid wall largely retains its outline. A shrinking animal cell is not described as plasmolysed because it has no wall for its membrane to pull away from.
| Surroundings compared with the cell contents | Initial net water movement | Animal-cell outcome | Plant-cell outcome |
|---|---|---|---|
| Higher free-water concentration | Into the cell | Swelling; possible lysis | Increasing turgidity; wall pressure limits entry |
| Lower free-water concentration | Out of the cell | Shrinkage; crenation in red blood cells | Loss of turgidity; possible plasmolysis |
| Matching free-water concentration, with no pressure difference | No net movement | Approximately steady volume | No net gain of water to build turgor |
The comparison is always between the outside solution and the cell contents. Calling a solution “concentrated” alone does not tell you the direction unless the internal concentration is known or the relative free-water concentrations are supplied.
Percentage mass change
Changes in tissue mass can provide evidence of net water movement when other causes of mass change are controlled.
For example, matched potato strips can be weighed before and after immersion in different sucrose solutions. Use comparable strips from the same tissue source, with matched dimensions, immersion time and temperature. Blot each consistently before weighing, so a film of solution on the surface is not mistaken for water taken into the tissue. Repeats reveal variation between strips. These choices help us interpret a change as net water gain or loss rather than a difference in the treatment or weighing procedure.
Raw mass changes are harder to compare if strips start at different masses. Express the change as a fraction of the original mass, then multiply by 100 to obtain a percentage.
Use the same mass units for both measurements. The percentage has no mass unit; retain the positive or negative sign.
A strip changes from to . Its change is , so the fractional change is , and the percentage change is . It has gained mass, consistent with net water entry. The denominator is the initial , not the final mass. A second strip changes from to : . The negative sign records a loss, consistent with net water leaving.
The following original illustrative data show the type of comparison this supports. Each final mass is for a strip with the stated initial mass; the numbers are teaching examples, not results from a reported experiment.
| Sucrose concentration / | Initial mass / | Final mass / | Percentage mass change |
|---|---|---|---|
| 0.00 | 4.00 | 4.40 | +10% |
| 0.20 | 4.00 | 4.04 | +1% |
| 0.40 | 4.00 | 3.68 | −8% |
Mass gain decreases as external sucrose concentration increases, and becomes mass loss. This fits the external free-water concentration falling: the dilute treatment favours net entry and the concentrated treatment favours net loss. The 0.20 treatment is closest to zero mass change among those supplied. A zero-change concentration would lie between 0.20 and for a continuous trend, but these three values do not establish its exact value. Near-zero tissue mass change does not prove that every cell has identical contents, or that molecular water exchange has stopped.
Positive percentage mass change indicates net mass gain; negative change indicates net mass loss. If osmosis is the cause, these correspond to net water entry and net water exit. Zero net change can coexist with movement both ways.
To apply this reasoning, calculate the sign and size of the change first, then link the sign to the movement of water under the stated conditions.