Core practical 3 - Investigating membrane permeability
Beetroot can colour its surrounding water when cell membranes become more permeable. You will learn how to investigate the effect of temperature or alcohol concentration, measure pigment release with a colorimeter, and decide how strongly the results support a conclusion about membranes.
Pigment and the two membranes
The red-purple betalain pigments of raw beetroot are stored in the cell's vacuole, rather than freely in the surrounding water. The tonoplast is the membrane around the vacuole. The cell-surface membrane surrounds the cytoplasm, just inside the cellulose cell wall. Both membranes normally retain most of this pigment during a short investigation.
Membrane permeability
The ease with which a substance crosses a membrane under specified conditions. In this practical, pigment released into the surrounding liquid provides an indirect indication of changes in permeability.
For pigment to reach the external liquid from a vacuole, it must cross the tonoplast, enter the cytoplasm, then cross the cell-surface membrane. The cellulose cell wall is porous to the pigment; it is not the selectively permeable barrier being investigated. A pink solution therefore does not identify which of the two membranes changed first.
The fluid mosaic model helps explain the prediction. Increasing temperature increases molecular motion and can disrupt the organisation of membrane lipids; sufficiently high temperatures also alter membrane protein structure. Ethanol interacts with membrane lipids and can disrupt their organisation and alter membrane protein behaviour, consistent with experimental evidence from model bilayers. These changes can reduce the membranes' ability to retain pigment. Proteins can denature; phospholipids do not “denature” in the protein sense. Neither treatment needs to destroy the cell wall to release pigment.
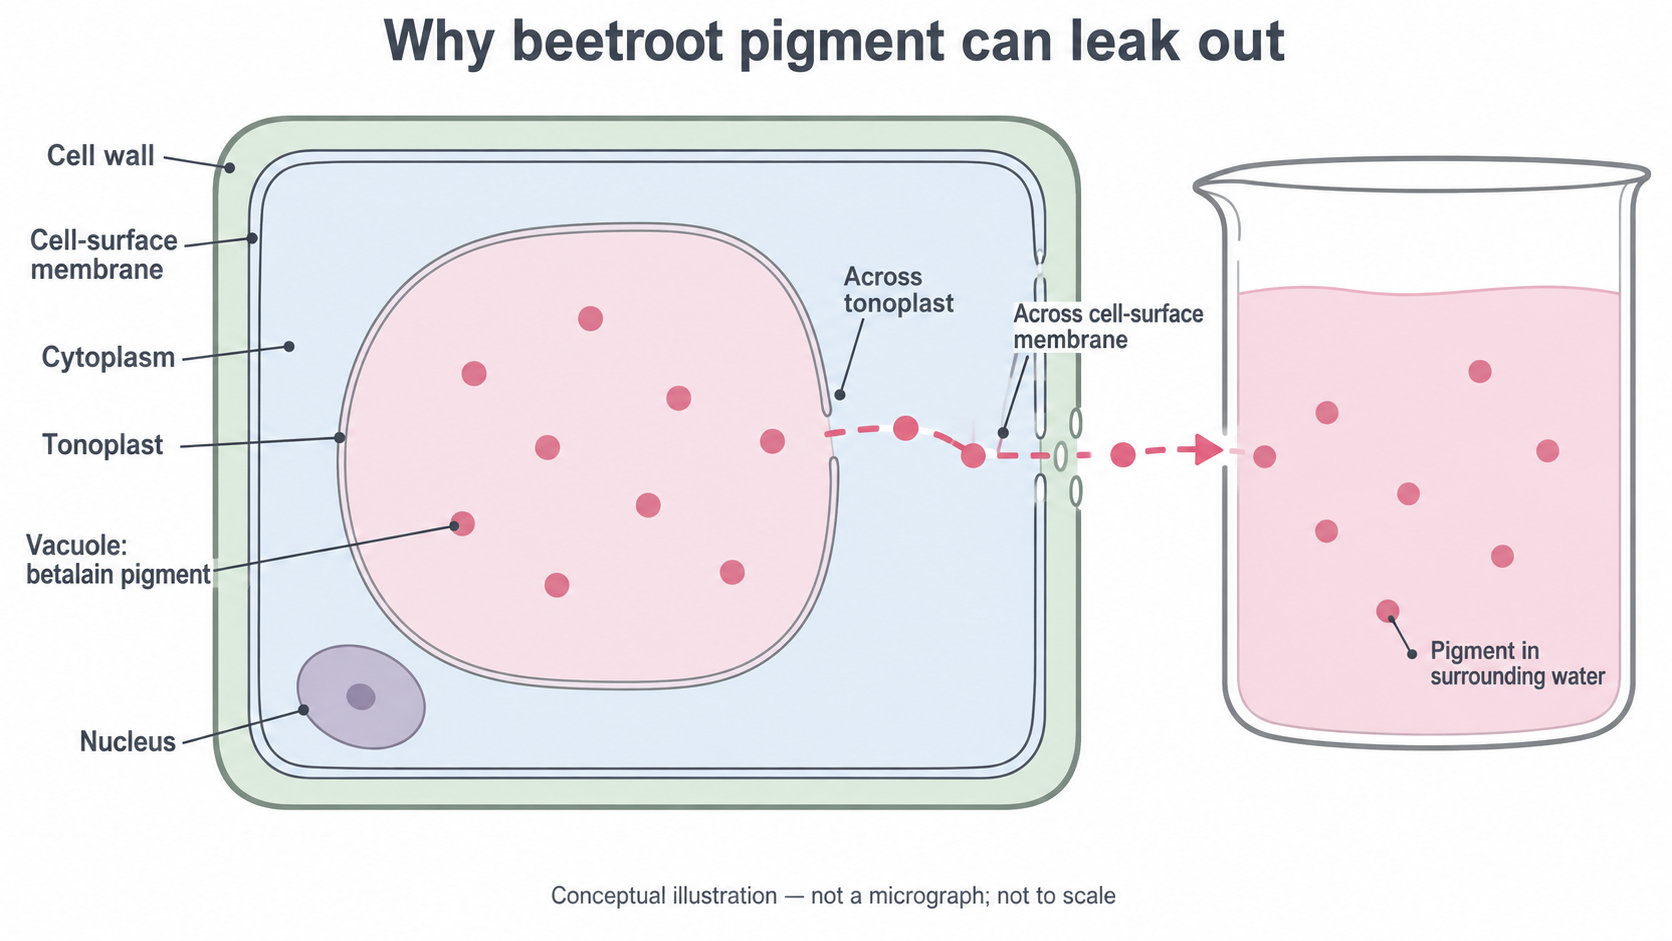
Conceptual illustration: the outward route crosses both membranes and the porous wall. The openings symbolise loss of the membrane barrier; they are not measured holes or evidence that the wall was destroyed. This is not a micrograph and has no scale for measurement.
A testable hypothesis is: “Greater temperature, within the selected range, increases pigment release from comparable beetroot samples during a fixed exposure.” The corresponding prediction is greater absorbance of the surrounding liquid. The alcohol alternative predicts greater release as ethanol concentration increases at constant temperature. These are predictions to test, not instructions to alter results to fit the expected pattern.
Comparable tissue and controls
Pigment concentration in the liquid depends on the tissue and handling as well as on the treatment. Preparing comparable tissue makes the comparison a valid test of temperature or ethanol concentration.
Use raw, unpickled beetroot. Cooked tissue may already have damaged membranes; pickling introduces previous chemical treatment. Under teacher supervision, cut cylinders with the same cork borer and trim them to the same measured length, such as 10 mm. Keep fingers away from the cutting path, work on a firm tile, cut away from the body and carry sharp tools in a tray. A technician may prepare the cylinders if the local risk assessment requires it. Wear eye protection and a laboratory coat; beetroot stains clothing and benches.
Take the cylinders from the same beetroot for the initial controlled comparison. Avoid skin and visibly damaged pieces. Cutting ruptures cells and releases pigment independently of the intended treatment. Wash the cylinders in several changes of distilled water until the wash water is clear, or use the centre's overnight soaking preparation, followed by rinsing. Give all samples the same washing treatment and blot gently; squeezing them damages more cells. Randomly allocate the prepared cylinders to treatments so that one part of the beetroot is not systematically assigned to the hottest bath.
| Variable | How to control or measure it | Why it matters |
|---|---|---|
| Tissue diameter, length and number | Same borer, measured 10 mm length, one cylinder per tube | Changes the amount of pigment available and the tissue surface exposed |
| Beetroot source and preparation | Same beetroot initially; same washing and gentle handling | Limits differences in pigment content and damage from preparation |
| Liquid volume | Measure 5.0 cm³ into every tube with suitable pipette or measuring cylinder | The same released pigment produces a lower concentration in a larger volume |
| Exposure time | Time each tube separately for 30.0 minutes | A longer exposure can allow more pigment to escape |
| Temperature in an alcohol investigation | Maintain and check the same temperature | Temperature would otherwise be a second changing factor |
| Ethanol concentration in a temperature investigation | Use distilled water throughout | Keeps solvent treatment constant |
| Colorimeter settings and optical path | Same filter, cuvette type and orientation | Makes readings comparable |
The independent variable is the factor deliberately changed: temperature or ethanol concentration, in separate investigations. The dependent variable is the absorbance of the external solution after the set time. Do not change both independent variables together and then attribute the difference to only one.
Keep a contemporaneous laboratory record: sample dimensions, treatment, measured temperature, start and finish times, raw readings, repeats and unexpected events. Before colorimetry, observe the tubes against white card. Make a scientific drawing from your own observation of a selected tube: use clear outlines, straight non-crossing label lines and annotations for liquid level, colour and visible cloudiness. Label its actual treatment and time. This drawing records an observation; it cannot show unseen membrane damage. An online diagram cannot replace your own observed drawing.
Use only the plant tissue needed, avoid food consumption in the laboratory and follow the centre's plant-tissue and solvent disposal procedures. The investigation measures a response of plant tissue; accurate reporting and proportionate use of material are part of responsible practical work.
A controlled temperature investigation
Temperature can be varied while the tissue, medium and exposure time remain constant. The following is a complete supervised laboratory plan; the teacher checks equipment and the local risk assessment before it is carried out.
Use the prepared cylinders, labelled boiling tubes and racks, distilled water, a pipette or suitable small measuring cylinder, a timer, thermometers, thermostatically controlled water baths and an ice-water bath. Include a colorimeter, matching cuvettes, a pipette for transferring liquid and a clean strainer for removing tissue without squeezing it. Select equipment that can resolve the intended differences; a large measuring cylinder is a poor choice for a small volume.
- Set baths to 0, 10, 20, 30, 40, 50, 60 and 70 °C. Check their actual temperatures with thermometers; the bath dial alone is not a measurement. Record departures from the intended temperatures. Maintain the ice bath and check the warmer baths during incubation.
- Label three separate tubes at each temperature, giving 24 independent tissue incubations. Add 5.0 cm³ distilled water to each. Place them in the appropriate bath for about five minutes, checking that the liquid has equilibrated to the bath temperature. Keep the bath water above the tube's sample-liquid level but below its rim.
- Place one freshly prepared cylinder in each tube and record its start time. Stagger the starts if needed so every tube can be stopped after 30.0 minutes. Use a rack and suitable handling tools for hot tubes. Hot water at 60–70 °C can scald; avoid splashing and let the teacher handle bath filling and adjustments. Keep electrical equipment dry.
- At the specified endpoint, separate the liquid from the cylinder, for example by carefully decanting through a clean strainer into a labelled receiving tube. Do not squeeze or spear the tissue. Gently mix the recovered liquid. Removing the tissue stops further leakage into the sample during the wait for a reading.
- Bring all recovered liquids to the same room temperature before reading them, without adding water or losing liquid by evaporation. Keep covered and use a consistent, short delay between separation and reading. Record qualitative observations and measure each sample's absorbance by the method in the next measurement section.
- Include tissue incubated at 20 °C as a comparison condition showing ordinary leakage during the same time. Also process a water-only tube with no tissue at each temperature to check contamination or effects of the apparatus. It is not a replacement for the tissue comparison. Use the three separate tissue incubations to calculate a mean at every temperature.
These independent repeats estimate variation among tissue incubations. Reading one cuvette three times can check instrument repeatability, but cannot replace three cylinders incubated independently. Sharing class data is useful only if tissue preparation, volume, timing and readings use the same agreed protocol.
This plan adapts the temperature investigation in the Pearson SNAB Core Practical 3 guidance and the Nuffield/RSB Practical Biology guidance; the repeated incubations and explicit handling controls make the comparison more informative.
The alcohol concentration alternative
Ethanol concentration can be investigated with the same leakage measurement while holding temperature constant. Use a separate set of washed cylinders; previously heated cylinders would introduce another treatment.
Ask the teacher to supply clearly labelled ethanol solutions, for example 0, 10, 20, 30, 40, 50, 60 and 70% by volume, with enough of each for the repeats. Percentage by volume, written % v/v, describes the volume of ethanol per 100 units of final solution volume. A nominal 40% v/v solution contains 4.0 cm³ ethanol per 10.0 cm³ final solution. When preparing from pure ethanol, water is added to the final volume rather than assuming that 4.0 cm³ ethanol plus 6.0 cm³ water has exactly 10.0 cm³ volume: mixing can change total volume.
Glassware can also be used to make a serial dilution, in which each new diluted solution becomes the stock for the next. For example, under supervision, transfer 5.0 cm³ of supplied 70.0% v/v solution with a pipette and make up to 10.0 cm³ with distilled water in suitable volumetric glassware. Mix it thoroughly. The final volume is twice the transferred stock volume, so the concentration is halved to 35.0% v/v. Repeating the procedure using this new solution gives 17.5% v/v. Use clean glassware, avoid carry-over and label every stage. This is an alternative spacing of concentrations; record the concentrations actually used rather than calling them 10% steps.
For a dilution in which the amount of ethanol transferred is conserved, let be the stock concentration, the final concentration, the stock volume transferred and the final solution volume:
Use the same volume units in numerator and denominator; the ratio has no unit. Express both concentrations on the same basis, here % v/v.
For the investigation, label three tubes per concentration and put 5.0 cm³ of the specified solution in each. Equilibrate all tubes to the same temperature, such as 20 °C, and monitor it. Add one comparable cylinder per tube, incubate for 30.0 minutes and record each tube's times. Separate tissue without squeezing, mix the liquid, observe it and obtain absorbance readings using matching solvent blanks. Use the 0% ethanol tubes, which contain distilled water and tissue, as the biological comparison. Include solvent-only tubes without tissue to check contamination/background at each concentration. Keep tissue amount, solution volume and handling the same throughout.
Ethanol is flammable: keep all solutions away from flames and ignition sources, use small quantities, replace stock-bottle caps and follow the teacher's spill and waste instructions. Eye protection reduces splash risk. Do not heat ethanol to vary the temperature in this alternative: temperature is a controlled variable. Use solvent-compatible cuvettes and glassware approved for the chosen concentration. The Pearson CP3 alcohol procedure provides the starting investigation, with local risk assessment required.
Measuring pigment with a colorimeter
A colorimeter passes light through a solution and measures how much light reaches a detector. Betalain absorbs suitable wavelengths, so a more concentrated pigment solution absorbs more light and transmits less.
Absorbance
A dimensionless optical measure of light absorption. At a fixed wavelength and path length, within the instrument's validated range, greater pigment concentration gives greater absorbance.
Use absorbance mode and a green or blue-green filter, around 530 nm if the instrument offers that wavelength. Keep this setting throughout. Absorbance is not “percentage absorbance”; percentage transmission is a different output and decreases as absorption increases. The Nuffield/RSB method specifies the filter/wavelength and distinguishes its example transmission results from absorbance.
- Switch on the instrument and follow its warm-up and checking instructions. Prepare a blank, which contains the medium but no beetroot pigment. For the temperature investigation, use distilled water. For the ethanol investigation, use a pigment-free solution of the same ethanol concentration as the sample: this accounts for solvent background as well as the cuvette.
- Fill a clean matching cuvette with enough liquid to cover the light beam, such as 2.0 cm³ if this is suitable for the instrument. Wipe its clear sides, remove bubbles and insert it so the light passes through those sides. Hold cuvettes by the frosted sides or top, avoiding fingerprints on the optical faces.
- Set the blank to zero absorbance. At a fixed solvent concentration, measure the corresponding samples without changing the filter or other settings; use the appropriate matching blank when the solvent concentration changes. Recheck the blank periodically to detect drift.
- Use separate clean cuvettes or rinse thoroughly between solutions, including a small rinse with the next sample to avoid dilution by residual water. Keep the same cuvette type, liquid level and orientation. Measure every independent incubation and record raw absorbance at the display's supported resolution, for example 0.01.
The 5.0 cm³ incubation volume is 5.0 mL, or 5000 mm³: 1 cm³ = 1 mL = 1000 mm³. The 2.0 cm³ transferred to the cuvette is an aliquot of the mixed sample; it does not represent only two-fifths of its pigment concentration. The optical path length through the liquid is what must remain comparable, provided the beam is covered.
Cloudiness, particles, fingerprints and bubbles can scatter light and give a misleading high absorbance. Blanking corrects medium/cuvette background, not those faults or damage to the tissue during cutting. If a sample exceeds the reliable range stated for the instrument, dilute it by a recorded factor in its matching medium and remeasure. Recovering the undiluted absorbance by a dilution factor requires a checked linear response, for example a suitable pigment calibration series; do not automatically multiply a saturated reading. An absolute pigment concentration requires calibration against known standards. This practical can compare absorbance without claiming pigment mass or a permeability coefficient.
Means, precision and plotting
A table preserves the raw evidence, while a graph makes the treatment-response pattern easier to inspect. The complete dataset below is an original constructed practice example, not results from a performed practical. It assumes the temperature method above: one washed 10 mm cylinder in 5.0 cm³ water per tube, three independent incubations at each temperature, a 30.0-minute exposure and readings at 530 nm. Water-only controls read 0.00 after blanking. All eight temperatures are nominal; a real record must include the measured temperatures and any fluctuations.
| Temperature / °C | Absorbance, repeat 1 | Absorbance, repeat 2 | Absorbance, repeat 3 | Mean absorbance | Minimum–maximum | Example colour observation |
|---|---|---|---|---|---|---|
| 0 | 0.02 | 0.03 | 0.04 | 0.03 | 0.02–0.04 | Almost colourless |
| 10 | 0.03 | 0.04 | 0.05 | 0.04 | 0.03–0.05 | Very pale pink |
| 20 | 0.06 | 0.07 | 0.08 | 0.07 | 0.06–0.08 | Pale pink |
| 30 | 0.10 | 0.11 | 0.12 | 0.11 | 0.10–0.12 | Pale pink |
| 40 | 0.18 | 0.20 | 0.22 | 0.20 | 0.18–0.22 | Pink |
| 50 | 0.34 | 0.37 | 0.40 | 0.37 | 0.34–0.40 | Pink |
| 60 | 0.60 | 0.64 | 0.68 | 0.64 | 0.60–0.68 | Deep pink |
| 70 | 0.90 | 0.94 | 0.98 | 0.94 | 0.90–0.98 | Deep pink |
The arithmetic mean of independent repeat readings is
Absorbance and its mean are dimensionless; dividing by the repeat count does not introduce a new unit.
At 50 °C, the mean is (0.34 + 0.37 + 0.40) ÷ 3 = 1.11 ÷ 3 = 0.37. For a different possible set of readings, 0.18, 0.20 and 0.23, the unrounded mean is 0.20333…, reported as 0.20 when the reading resolution is 0.01. Retain the unrounded value through later calculations before rounding the final result. A calculator's extra digits do not establish extra measurement accuracy. Decimal places and significant figures are related but different: 0.20 has two significant figures, whereas 0.02 has one; both have two decimal places. Follow the measurement resolution and any stated reporting instruction, rather than forcing the same number of significant figures onto all absorbance readings.
To plot the two variables yourself on graph paper or suitable graphing software:
- Put the independent variable, temperature / °C, on the horizontal axis and mean absorbance on the vertical axis. For the alcohol alternative, the horizontal label becomes ethanol concentration / % v/v.
- Use continuous numerical scales and enough space for the data: here 0–70 °C horizontally and 0.00–1.00 vertically work. Equal temperature intervals occupy equal distances; this is not a categorical bar chart.
- Plot all eight mean coordinates accurately: (0, 0.03), (10, 0.04), (20, 0.07), (30, 0.11), (40, 0.20), (50, 0.37), (60, 0.64) and (70, 0.94). For example, (40, 0.20) is two-tenths of the way up a 0–1 absorbance axis.
- If showing repeat variation, add vertical bars from the minimum to maximum at each temperature and name them range bars. At 50 °C the bar runs from 0.34 to 0.40; it is not a confidence interval or instrument-uncertainty bar.
- Add an appropriate trend guide without forcing a straight line. The displayed graph joins means only to guide the eye; it does not measure intermediate temperatures. A smooth best-fit curve would also be defensible if clearly identified as an interpretation.
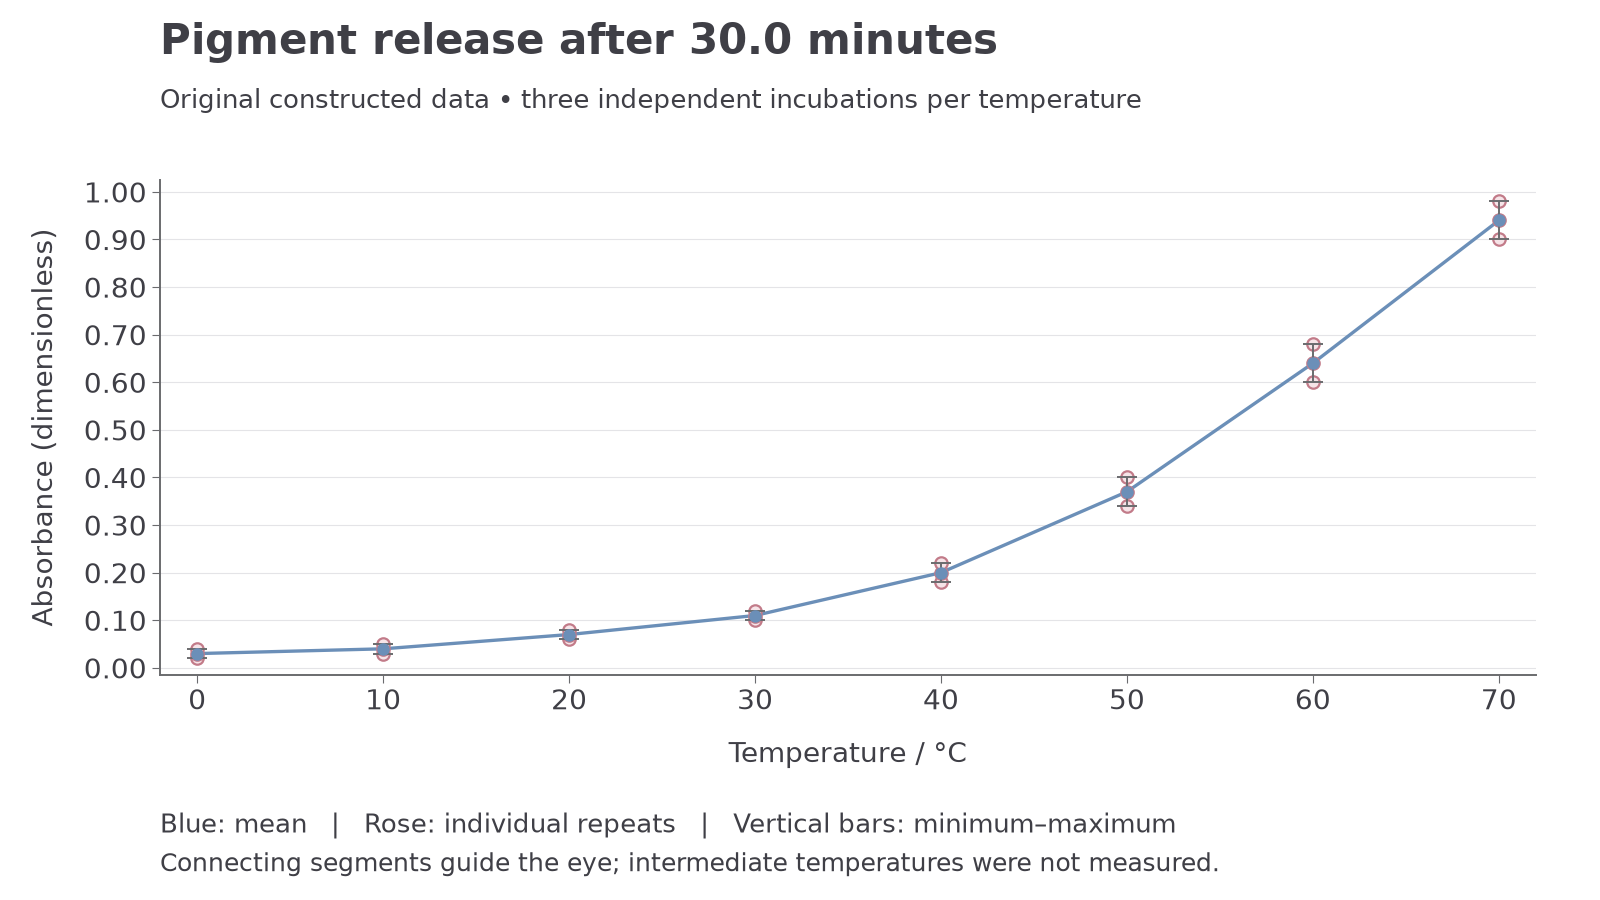
All plotted coordinates come from the complete constructed dataset. Blue points are means; pale rose circles are individual repeats; a repeat equal to the mean is overlapped by the blue point. Vertical bars span the minimum and maximum. The connecting segments guide the eye and do not establish values between the sampled temperatures.
Use the table to check every plotted point in your own graph. Creating the graph is the plotting skill; describing this supplied graph alone does not demonstrate that you plotted data. Keep all raw readings. If a reading appears anomalous, investigate and record a reason, such as a visible bubble or timing error, and repeat the measurement or incubation as appropriate. Do not delete an inconvenient reading just to make a smoother trend.
Measurement and combined uncertainty
A measurement is an estimate with limits, even when no obvious mistake has occurred. An absolute uncertainty states a bound in the quantity's own unit; a percentage uncertainty compares that bound with the measured magnitude. Absorbance is dimensionless, so its absolute uncertainty also has no physical unit.
For a nonzero measured magnitude with absolute uncertainty :
Use a justified uncertainty estimate. Display resolution alone is not proof of the manufacturer's accuracy.
Suppose an absorbance reading is 0.64 and the stated instrumental bound is ±0.01. Its percentage uncertainty is (0.01 ÷ 0.64) × 100 = 1.5625%, or about 1.6%. A 0.04 reading with the same bound has a 25% uncertainty. The same absolute bound matters much more for a small signal. A percentage uncertainty at zero is undefined. Thermometer uncertainty should be stated in °C; calculating a percentage using Celsius is generally inappropriate because its zero is arbitrary.
Combining a difference and a quotient
For a simple conservative estimate, add the absolute bounds when quantities are added or subtracted. Take a single high-temperature reading of 0.64 ±0.01 and a comparison reading of 0.07 ±0.01. The excess over the comparison is
Thus the difference is 0.57 ±0.02 and its percentage uncertainty is (0.02 ÷ 0.57) × 100 = 3.5088…%, about 3.5%. This is a bound estimate, not a standard deviation or a probability interval.
If a mean excess-leakage proxy per minute is defined as , use the same units for both time and its bound. With , where ±0.2 min is an assumed timing/handling bound, . Since 0.2 min is 12 s, using 1800 ±12 s would describe the same time uncertainty.
For a quotient or product, adding the percentage uncertainties gives a simple approximate conservative estimate when the relative bounds are small:
The absolute bound is approximately 0.0190 × 0.041754 = 0.000793…, so report . This calculation combines only the assumed absorbance and timing bounds. It omits other sources such as differences in pigment content and volume. It is an average endpoint proxy, not an instantaneous rate, a direct membrane permeability coefficient, or evidence that the rate was constant for 30 minutes.
Repeats and errors
The range 0.60–0.68 at 60 °C describes variation among three incubations. Its width is 0.08; its half-range is 0.04. It includes biological and procedural variation and is different from the instrument bound ±0.01. Do not automatically divide either a bound or a range by the repeat count. Averaging can reduce the influence of independent random variation, but a shared calibration offset may affect every reading and persist in the mean.
Precision concerns measurement resolution or how closely repeated results agree, depending on context. Accuracy concerns closeness to the true value. Repeatability means obtaining similar results using the same method, operator and apparatus. Validity concerns whether the design actually tests the intended question. A precise colorimeter can still give inaccurate readings if wrongly blanked; many repeats do not correct a systematic volume difference between treatments. Read temperature at eye level, inspect the meniscus of suitable volume glassware correctly and check instrument calibration to reduce avoidable measurement errors.
Conclusions and practical evaluation
A defensible conclusion links the measured pattern to the biology while keeping the limits of the method visible. In the constructed temperature dataset, mean absorbance rises from 0.03 at 0 °C to 0.94 at 70 °C. The rise is not constant: it is 0.01 from 0 to 10 °C but 0.30 from 60 to 70 °C. This supports increased pigment release with increasing temperature over the tested range, especially at the warmer conditions.
If the controls worked, increased pigment release is consistent with reduced retention by the tonoplast and cell-surface membrane. The controlled manipulation gives stronger evidence for a treatment effect than merely comparing unrelated beetroot samples, but colorimetry does not image the membranes or distinguish the contribution of each membrane. It also cannot by itself show that every membrane protein denatured at a particular temperature.
The 0 and 10 °C range bars overlap, whereas the 50 and 60 °C ranges do not. This helps describe the observed repeat variation, but overlapping or non-overlapping ranges are not a statistical significance test. With only three repeats, do not claim a precise threshold or a population-wide law. Do not extrapolate beyond 70 °C. At very high temperatures, pigment stability and the instrument's range may also limit the usefulness of absorbance as a leakage proxy. An alcohol investigation needs its own results; the temperature graph does not establish an ethanol response.
An evaluation should connect a limitation to its effect and a feasible improvement:
| Limitation | How it could affect the inference | Improvement |
|---|---|---|
| Unequal cylinders or variable pigment content | Different amounts of available pigment can mimic a treatment effect | Standardise dimensions; randomise allocation; later repeat the complete design with several beetroot roots |
| Unwashed cut surfaces or squeezing tissue | Adds pigment released by mechanical damage | Standardise washing and use non-squeezing separation |
| Bath fluctuates or solutions have not equilibrated | Actual exposure differs from the recorded treatment | Monitor sample/bath temperature and use controlled baths with adequate equilibration |
| Different incubation times or evaporation | Changes leakage duration or concentrates the liquid | Stagger timing, separate tissue at the endpoint and minimise evaporation consistently |
| Dirty cuvette, incorrect blank or drift | Produces an optical difference unrelated to pigment leakage | Inspect cuvettes, use matched blanks and recheck instrument response |
| Only one beetroot source | Limits generalisation to other biological samples | Use several roots, with every treatment represented within each root |
More independent replicates improve the estimate of repeat variation. More closely spaced temperatures in the region of a steep rise help locate where the response changes, without assuming a universal sharp transition. To test whether heating has altered pigment absorbance independently of leakage, a separately approved control could expose a cell-free pigment solution to the same heating and reading conditions. It would address pigment stability, whereas a water-only control could not.
Absorbance measures the pigment in the medium. Comparable tissue, controlled exposure and sound colorimetry make it useful evidence about membrane leakage; uncertainty and the indirect nature of the measurement limit the conclusion.
Core Practical 3 prepares you to use quantitative measuring apparatus, a colorimeter and laboratory glassware, make an annotated scientific drawing from observation, and investigate plant tissue safely. Keep your own methods, observations, raw data and source references in your practical record. Studying this lesson or analysing its constructed data cannot authenticate hands-on competence: the centre observes your practical work and judges the separately reported Science Practical Endorsement. All 18 core practicals belong to the course; the endorsement's minimum of 12 practical activities is a different requirement.