7.8 - Cardiac electrical control and ECGs
The heart needs to contract in the right sequence as well as at the right rate. In 7.8(i–iii), you will learn how cardiac muscle starts its own electrical activity, how specialised tissues coordinate a heartbeat, and how an ECG provides evidence about that activity. Measuring a trace lets you connect a visible pattern to a biological mechanism while recognising the limits of the evidence.
Myogenic muscle and the pacemaker
The stimulus for a normal heartbeat originates within the heart itself. Cardiac muscle is myogenic: it can initiate its own electrical excitation and contract without a motor nerve initiating each beat.
Myogenic
Having the stimulus for contraction originate within the muscle tissue itself.
The sinoatrial node (SAN) is a group of specialised cardiac cells high in the wall of the right atrium. These pacemaker cells spontaneously change their membrane potential, the electrical potential difference across their cell membranes. When a threshold is reached, an electrical impulse is generated. Repeated impulses normally set the heart's rhythm, so the SAN is called its pacemaker.
An impulse causes nearby atrial muscle cells to become electrically excited. Depolarisation is a change in membrane potential in which the inside becomes less negative relative to the outside. Excitation spreads between connected cardiac cells and triggers contraction. Repolarisation restores the membrane potential towards its resting state, allowing the tissue to recover before the next excitation.
Myogenic does not mean unregulated. Nerves and hormones can change how frequently the SAN initiates impulses; they do not normally supply the starting stimulus for every beat. Detailed control of rate belongs in 7.9. Similarly, generating an electrical signal does not remove the muscle's need for oxygen, respiratory substrates and ATP for sustained contraction.
The conduction pathway coordinates contraction
A useful heartbeat requires atrial contraction before ventricular contraction, followed by coordinated contraction of the two ventricles. The location and conduction properties of specialised cardiac tissues produce this sequence.
- The SAN initiates an impulse. Excitation spreads through the walls of both atria. Their depolarisation triggers atrial systole, moving the remaining atrial blood into the ventricles.
- The impulse reaches the atrioventricular node (AVN), low in the right atrium near the boundary between atria and ventricles. Conduction through the AVN is slow, creating a short delay. The atria can finish contracting and the ventricles can finish filling before ventricular systole begins.
- A layer of nonconducting fibrous tissue normally prevents excitation spreading directly from ordinary atrial muscle into ventricular muscle. The normal conducting connection passes through the AVN and the bundle of His, which conducts into the interventricular septum. Its branches carry excitation towards the heart's apex, the lower pointed region.
- Purkyne fibres, also commonly spelt Purkinje fibres, distribute excitation rapidly through the ventricular walls. Excitation reaches the apex region before spreading upwards through the walls. This coordinates ventricular contraction from the lower region towards the outlets near the top, helping eject blood into the pulmonary artery and aorta.
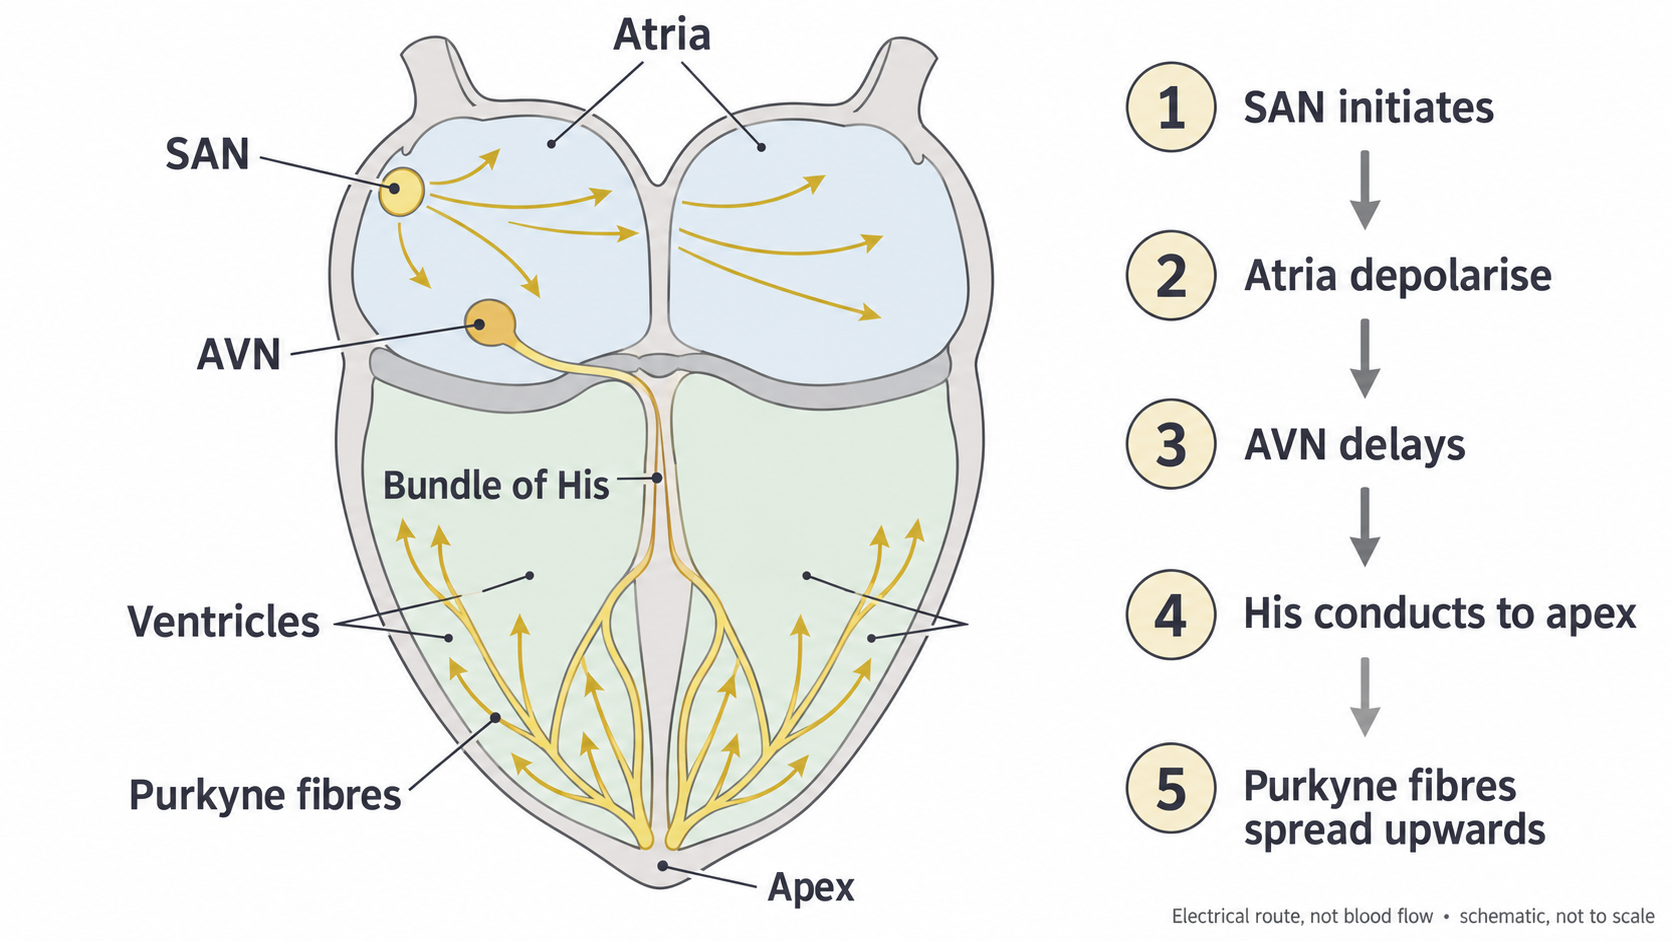
The SAN excites the atria; the AVN delays onward conduction; the His–Purkyne pathway delivers excitation rapidly to the ventricular walls. Arrows show electrical spread, not blood flow. This is a simplified schematic.
The AVN delay and rapid ventricular conduction have different benefits. A delay between atria and ventricles permits filling, whereas slow spread across the ventricles would make their contraction less coordinated. For example, slower conduction in one bundle branch can delay excitation on that side. It is therefore inaccurate to say that all parts of the pathway should conduct slowly, or that all four chambers should contract simultaneously. These links agree with the NHLBI account of cardiac conduction and conduction disorders.
What the ECG records
An electrocardiogram (ECG) is a record of changes in electrical potential difference detected using electrodes on the skin. It shows the combined electrical activity of many cardiac cells as seen from a particular lead, or electrical view. It is not a recording from inside one cell and does not directly measure blood pressure, blood flow or contraction force.
The horizontal axis represents time, usually in seconds. The vertical axis represents potential difference, commonly in millivolts, written mV. A normal simplified cycle has a small P wave, a sharp QRS complex and a broader T wave. The precise appearance depends on the lead, so an upward deflection is not a universal rule for every electrode arrangement.
| Trace feature | Electrical event | Relationship to mechanical activity |
|---|---|---|
| P wave | Depolarisation spreads through the atria | Atrial contraction follows this excitation. |
| QRS complex | Depolarisation spreads through the ventricles | Ventricular contraction begins after excitation and continues beyond the brief complex. |
| T wave | Ventricular repolarisation | Recovery of ventricular electrical activity is associated with the end of systole and subsequent relaxation. |
Atrial repolarisation occurs around the time of the QRS complex and is usually hidden by the larger ventricular signal. The letters Q, R and S describe deflections within one complex, not three separate heartbeats. The PR interval runs from the start of P to the start of QRS; the name does not mean that measurement begins at the P peak or ends at the R peak. It includes atrial depolarisation and onward conduction, including the AVN delay. These event and interval definitions follow Clinical Methods: Electrocardiography.
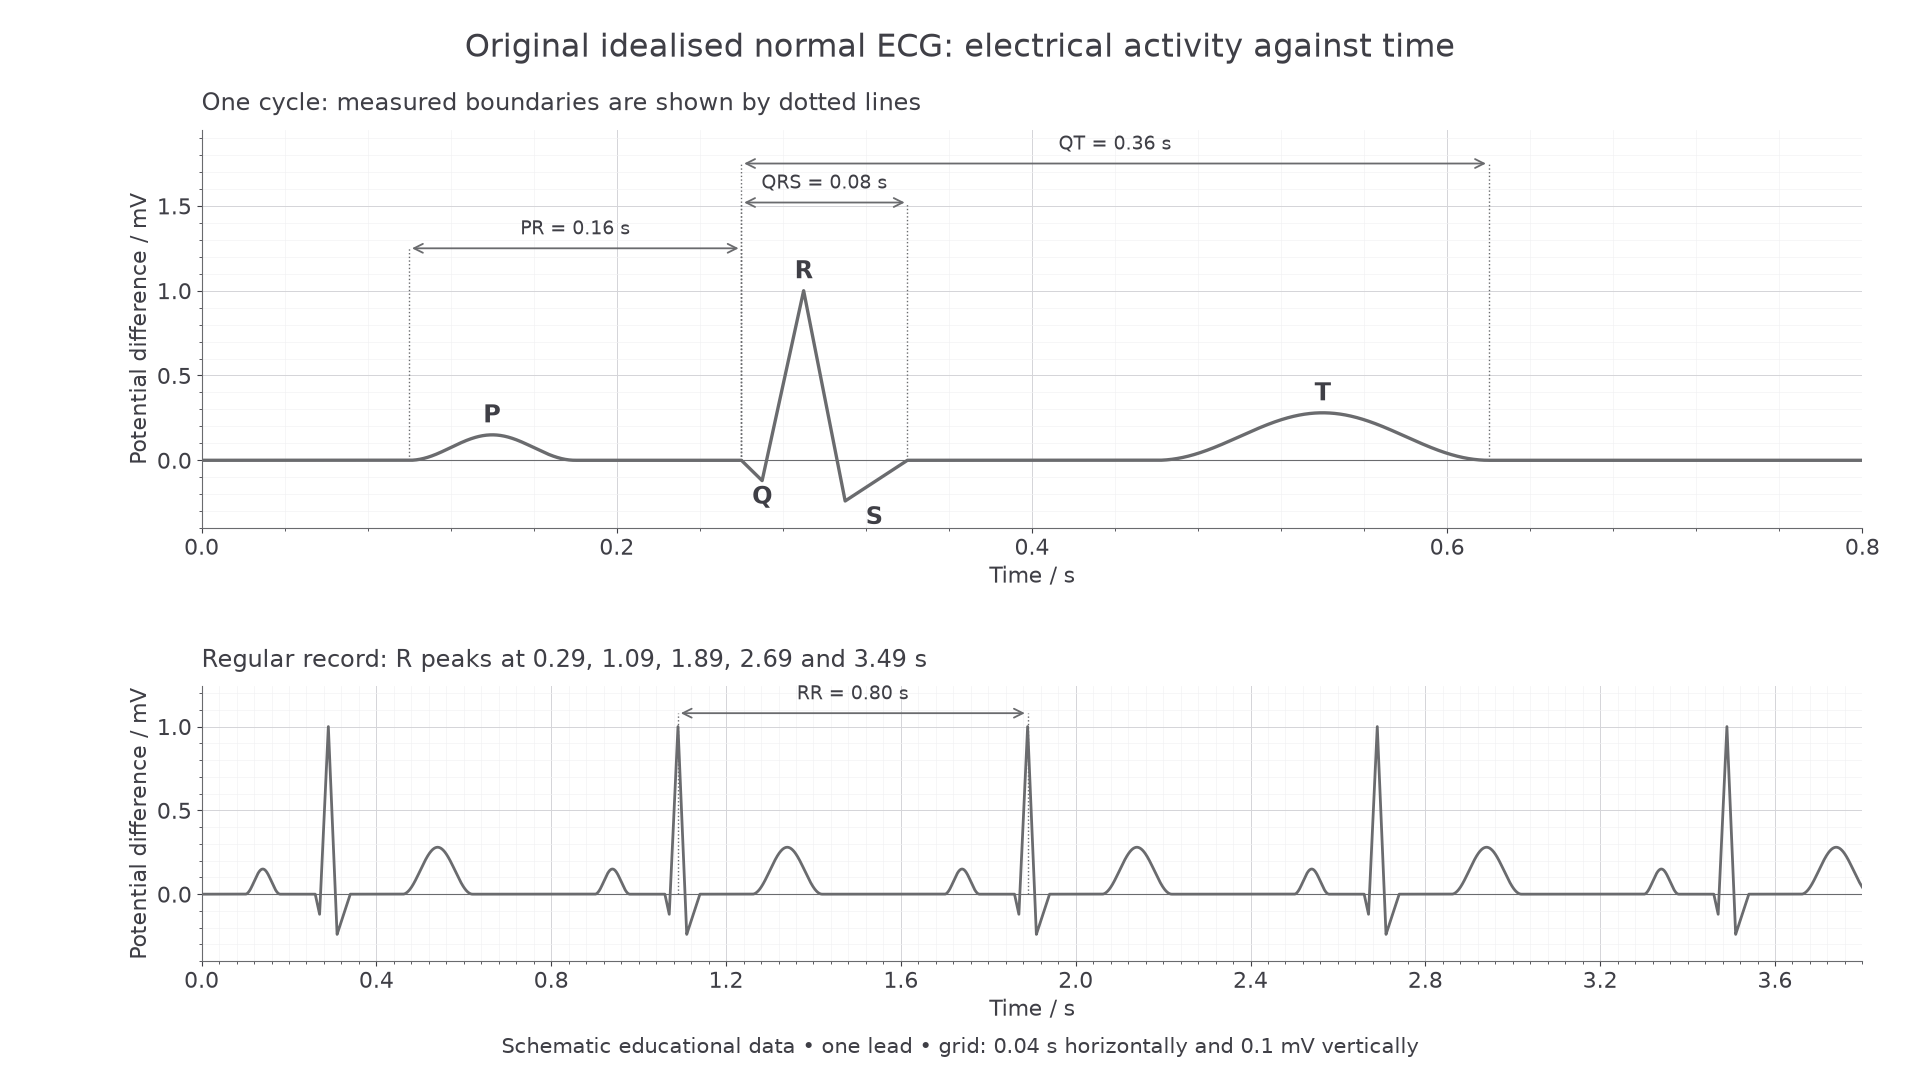
Original educational trace for one lead. The upper panel identifies electrical events and boundaries; the lower panel shows regularly repeated cycles. These are constructed data, not a patient recording.
Electrical and mechanical events are linked but are not identical. Depolarisation triggers processes inside muscle cells before force develops. Much of ventricular contraction occurs while the trace has returned near its baseline after QRS. A flat segment means little net changing potential difference in that view, not that the heart has stopped or that every muscle cell is electrically inactive. A larger ECG wave also does not by itself demonstrate a stronger contraction.
Measuring intervals and heart rate
An ECG becomes quantitative evidence when the axis scales and measurement boundaries are used correctly. Always read the scale supplied for that record: changing the horizontal scale changes apparent spacing without changing the underlying heart rate.
In the upper normal trace, P starts at , QRS starts at and ends at , and T ends at . Subtract the earlier time from the later time:
- PR interval: .
- QRS duration: .
- QT interval, covering ventricular depolarisation and repolarisation: .
The RR interval is the time from one R peak to the next. In the lower normal record, consecutive R peaks at and give . For a regular rhythm, this is the duration of one ventricular cycle.
For a regular rhythm, when one QRS complex represents one ventricular beat:
The numerator represents the in one minute.
The normal trace therefore gives . As a check, a cycle takes slightly less than one second, so the rate should be slightly above 60 per minute. Do not multiply 0.80 by 60: a longer cycle means a lower rate.
Continue this lesson.
You’re previewing NovaLearn without an account. Create a free account to read the rest.
Create free account