6.3, Core practical 14 - DNA profiling and gel electrophoresis
DNA can help identify the source of a biological sample and investigate how organisms are related. In 6.3, you will learn how to interpret profiles from plants and animals; in Core practical 14, you will learn how to separate DNA fragments and judge the quality of the resulting evidence. The practical explains why bands appear at different positions, and why even a matching pattern needs careful interpretation.
What a DNA profile compares
A DNA profile compares selected variable regions of DNA rather than reading every base in a genome.
DNA profile
A set of results for selected variable DNA markers that can be compared between biological samples.
Recall that DNA has a sequence of bases and a sugar–phosphate backbone. At some markers, a short base sequence is repeated several times. Different alleles can contain different numbers of repeats. If fragments include the same flanking regions, a larger repeat number produces a longer fragment. For a hypothetical marker with 100 base pairs of fixed flanking DNA and a four-base repeat, 8 repeats produce a 132 bp fragment, whereas 11 repeats produce a 144 bp fragment. Here bp, base pairs, measures the length of double-stranded DNA; it is not a distance in millimetres on a gel.
Selected fragments must first be obtained from extracted DNA. Restriction enzymes can cut DNA at particular recognition sequences; differences between samples can produce different fragment lengths. Older profiling methods used additional steps to detect selected variable fragments among the many fragments produced. Modern repeat-marker profiling usually copies selected regions, then separates their products, often by automated capillary electrophoresis. Copying DNA by PCR is the next lesson; its temperature cycle is not needed to understand separation here.
A classroom gel of supplied DNA fragments teaches separation and pattern comparison. It is a model of part of a profiling workflow: staining an arbitrary whole-genome digest does not automatically give a useful forensic profile. A visible band contains many DNA molecules with sufficiently similar migration, not one molecule. The same organism's nucleated body cells normally provide the same selected inherited markers, while different individuals may share some alleles. Using several informative markers makes a comparison more discriminating than using one.
Why DNA separates in a gel
An electric field moves DNA through a porous gel because DNA carries an overall negative charge from its phosphate groups.
In gel electrophoresis, wells near the negative electrode hold the starting samples. DNA migrates away from that end towards the positive electrode. An agarose gel is a water-filled mesh: shorter linear DNA fragments pass through its pores more easily than longer linear fragments, so they move farther in the same running time. A band nearer the wells therefore represents longer fragments than a band farther down the same properly run gel. This comparison assumes comparable DNA form and conditions; an uncut coiled plasmid must not be sized as though it were a linear fragment.
The running buffer supplies mobile ions that conduct current and helps maintain pH. Use the specified working buffer both in the gel and around it. Water alone is not an equivalent running medium. Gel concentration changes the pore network, so a concentration suitable for one size range may fail to resolve another. Samples being compared should run on the same gel where possible.
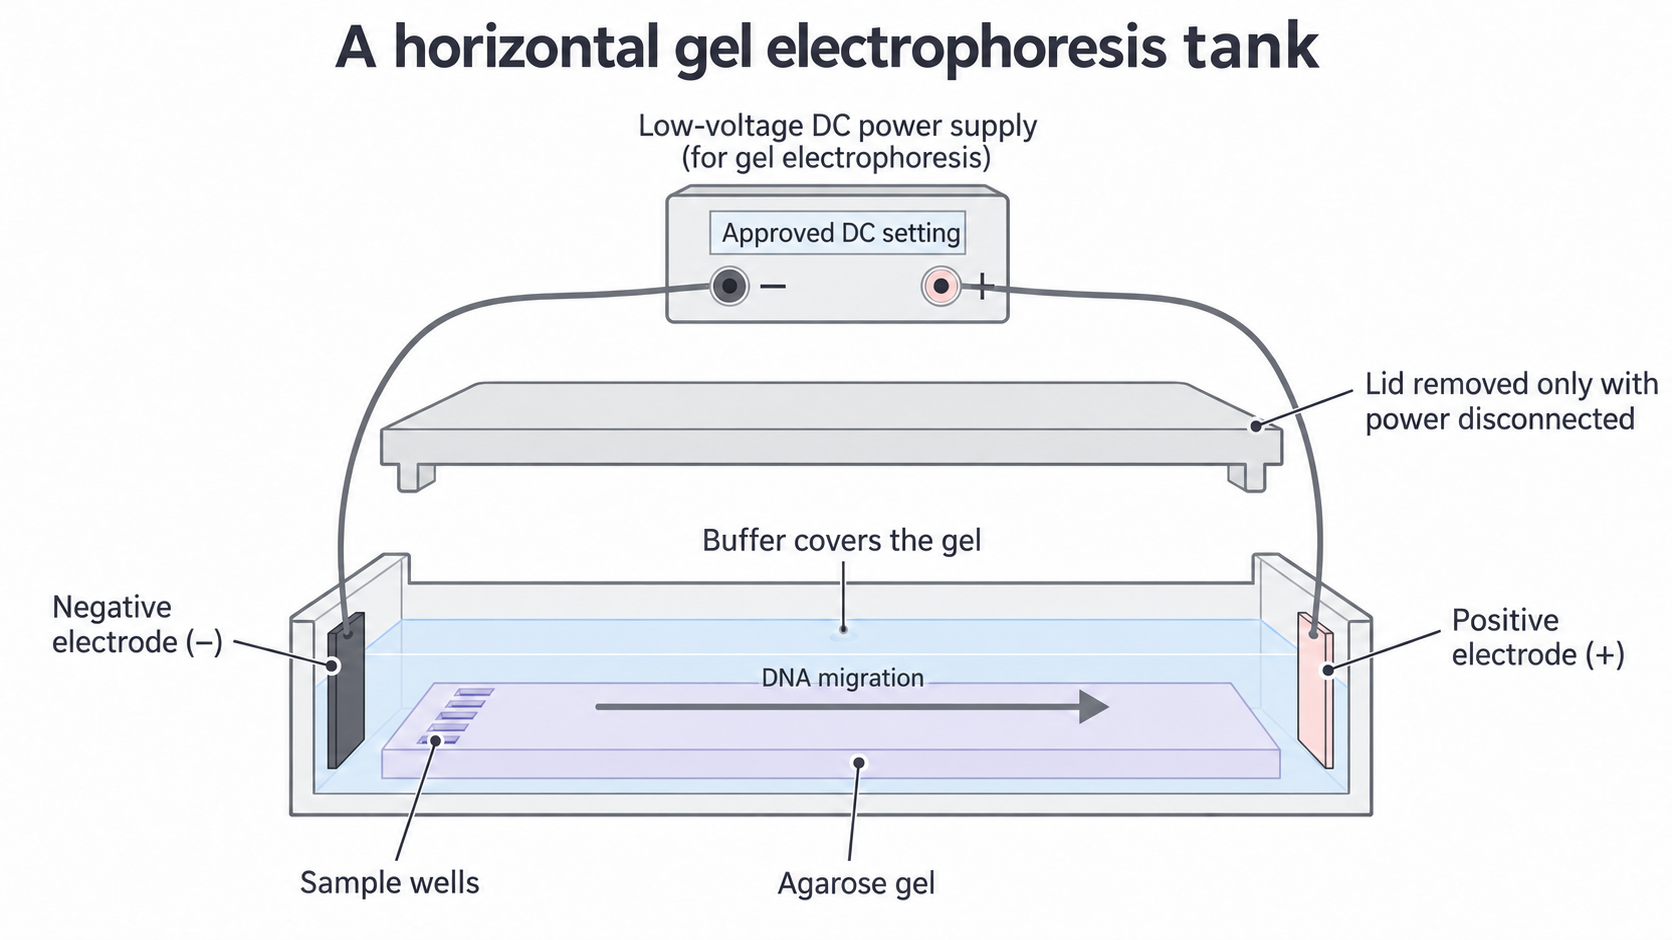
The apparatus schematic shows direction and arrangement, not a measured run. The lid is fitted before switching on; the supply is switched off and disconnected before the lid is removed.
A loading solution contains a dense component, such as glycerol, that helps a sample settle into its well, and a coloured tracking dye that shows loading and the progress of the run. Tracking dye is not evidence of the positions of all DNA fragments. A separate DNA-binding stain makes DNA bands visible, either during or after the run according to the chosen system.
Preparing a controlled separation
A valid comparison starts with labelled samples, suitable separation conditions and controls whose results have a clear purpose.
The aim of Core practical 14 is to separate fragments of different lengths. Use teacher-supplied, prepared linear DNA mixtures, a known-length DNA ladder, agarose, the specified buffer, casting tray and comb, electrophoresis tank and lid, an approved DC supply, micropipettes or suitable loading syringes, fresh tips, a timer, ruler and an approved stain system. The ladder is a collection of fragments of known lengths; it calibrates position against fragment size rather than acting as an unknown biological sample.
Preparing the gel and samples
- Draw a lane plan before loading. Include the ladder, unknown, reference samples, a no-DNA blank containing the sample preparation reagents, and a positive control containing known DNA fragments. Keep sample identity separate from an interpretation to avoid reading the expected result into the gel.
- Prepare the specified working buffer with measured volumes. For example, 10 mL of 10-times-concentrated stock plus 90 mL of water makes 100 mL of working-strength buffer. Mix thoroughly; do not run a gel in the concentrated stock. Use a measuring cylinder appropriate to the volume and read its scale at eye level.
- For a protocol specifying 0.8% mass per volume agarose, dissolve 0.8 g agarose in enough working buffer to make 100 mL. Heat in suitable glassware under supervision until dissolved, avoiding boiling over and evaporation. Let it cool to the protocol's pouring temperature, then cast it around the comb. Avoid bubbles at wells; allow full setting and remove the comb carefully. A ready-cast gel is also suitable.
- Prepare equal total loading volumes with the recommended final loading-solution concentration. For example, 8 µL DNA solution plus 2 µL of five-times-concentrated loading solution gives 10 µL at working strength. Use a pipette within its volume range, fit a fresh tip for each sample, and mix without creating bubbles. Never transfer a used tip between stock tubes.
The comparison changes which prepared DNA sample occupies a lane; measured outcomes are band number and migration distances. Keep gel concentration and thickness, buffer composition/concentration, voltage, running time and temperature comparable. Load comparable DNA amounts within the stain's useful range: overloading can create broad bands or smears, while too little DNA may be invisible. Equal volume alone does not ensure equal DNA amount if concentrations differ.
A blank checks for contamination during preparation/loading. A positive control checks that a known sample can be separated and detected. A ladder checks separation and permits length estimation. These purposes overlap but are not interchangeable: a visible ladder does not prove that the unknown was successfully loaded.
Safe and ethical choices
Use the centre's approved apparatus, stain instructions and risk assessment. Handle hot agarose with heat protection and eye protection; hot liquid can boil suddenly. Use the supply's specified setting for the tank and electrode spacing, with intact leads, dry hands and the lid fitted. Never increase voltage simply to finish sooner: excess heating can distort separation and create hazards. Switch off and disconnect before touching the buffer or gel.
For school work, an approved visible-light stain such as toluidine blue O avoids the need for a UV transilluminator. Follow its concentration, contact-time, glove/eye-protection and disposal instructions; “safer” does not mean harmless. A fluorescent system needs its specified light source and shielding. Ethidium bromide and unshielded UV are not default classroom choices. Use supplied DNA rather than collecting classmates' genetic profiles: real identifiable samples require informed consent, restricted access and appropriate disposal of samples and records. Learning the method online prepares you for practical work; hands-on competence and the practical endorsement must be authenticated by your centre.
Running and recording the gel
Careful loading preserves separate lanes so that a visible pattern can be traced back to the correct sample.
Place the set gel in the tank with wells towards the negative electrode and add working buffer to cover it to the specified depth. With the supply disconnected, load the ladder and samples according to the lane plan. Place the tip just into the buffer over a well, deliver slowly and avoid piercing the well floor or spilling into a neighbouring well. Fit the lid, check polarity and apply the approved setting. Record the voltage and start time. Watch the tracking dye; stop at the protocol's endpoint before useful fragments leave the gel. Record finish time and any heating, uneven movement or loading spill.
Switch off and disconnect the supply before opening the tank. Stain and, if required, destain using the selected protocol. Observe under the specified safe illumination. Record the actual outcome, including weak, broad, smeared or absent bands, rather than drawing the pattern expected from the labels. Make an annotated scientific drawing from observation: identify all lanes, wells, electrode direction, each visible band and any uncertainty. A photograph with a ruler alongside can supplement the drawing. Measure from the same well reference edge to each band centre, in millimetres, using a suitable ruler or calibrated image. Record the ruler resolution, not just the final distances.
The figure and table below are an original constructed teaching dataset, not observations from an experiment performed for this lesson. They demonstrate how a complete record can be analysed. In your own practical, substitute your actual observations, including failures. Assume these bands are narrow and readable to the nearest millimetre; P is a known positive control expected to have bands at 25 and 45 mm under these conditions.
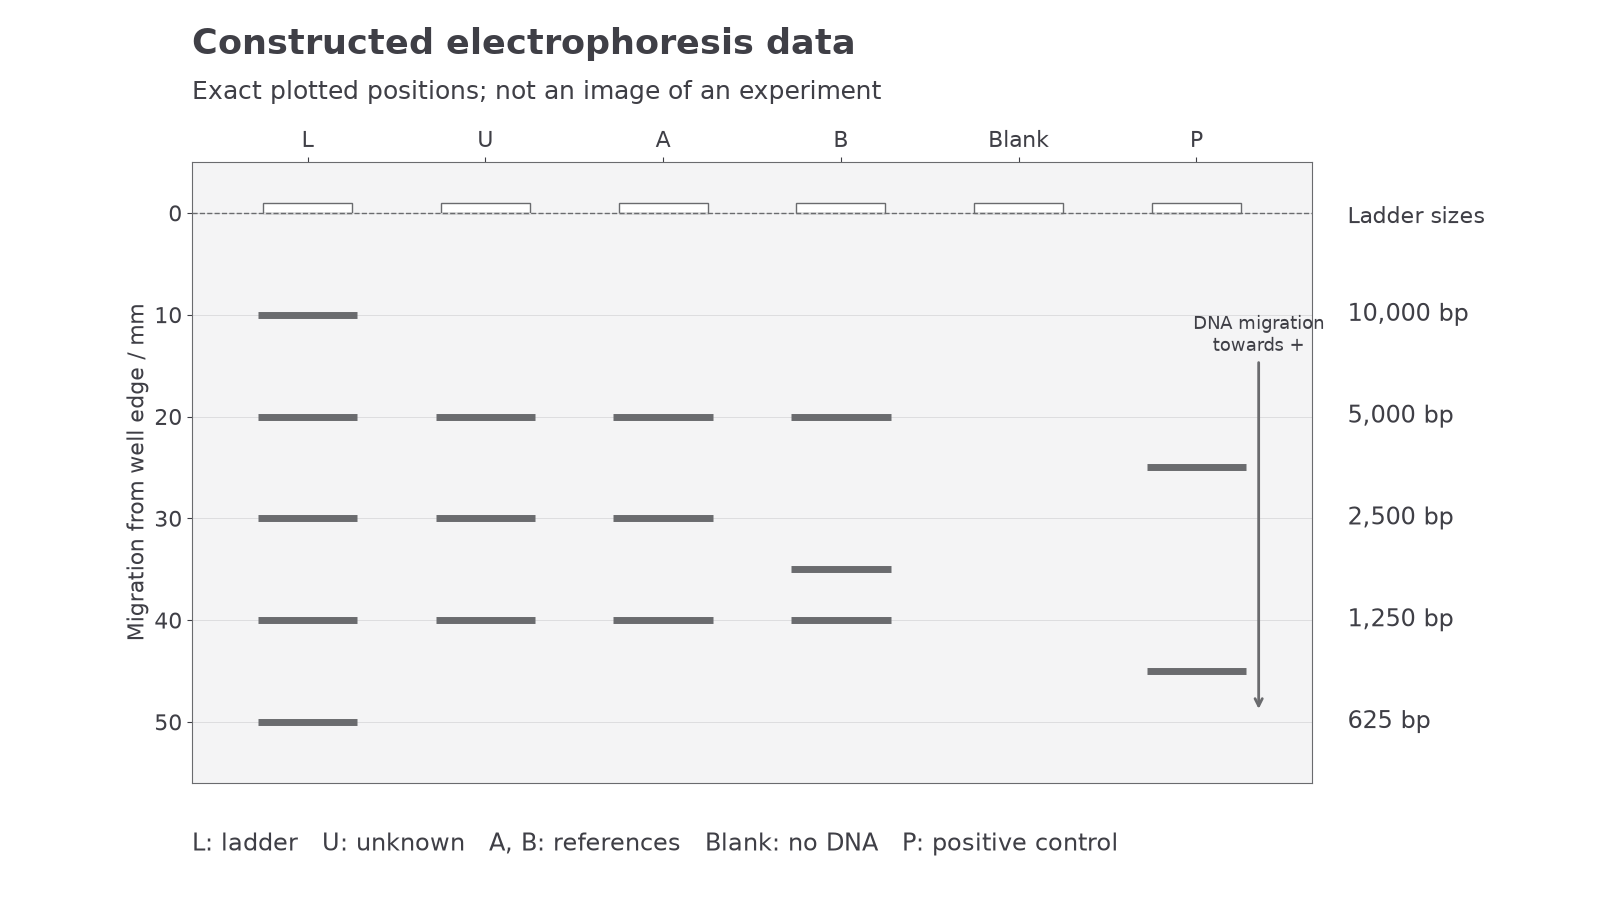
Positions are plotted from the fixed numerical dataset. Distance increases from the well edge towards the positive electrode; compare bands across lanes at the same distance.
| Lane | Sample | All visible band-centre distances from well edge / mm |
|---|---|---|
| L | Ladder | 10, 20, 30, 40, 50 |
| U | Unknown | 20, 30, 40 |
| A | Reference A | 20, 30, 40 |
| B | Reference B | 20, 35, 40 |
| Blank | Reagents without DNA | No visible band |
| P | Known positive control | 25, 45 |
The ladder has five resolved bands, the blank has no detected DNA, and P has its expected two bands. These observations support using this run for comparison. They do not prove that every tube is uncontaminated or correctly labelled. U and A share all three recorded positions; B differs at its middle band. The 35 mm band has moved farther than a 30 mm band, so it contains shorter fragments.
Calibrating fragment length
A gel measures migration distance directly; a ladder lets you translate that distance into an approximate DNA length.
For the constructed dataset, the complete ladder key is:
Continue this lesson.
You’re previewing NovaLearn without an account. Create a free account to read the rest.
Create free account