1.15 - Cholesterol evidence and lipoproteins
Cholesterol is needed by cells, yet some patterns of cholesterol transport increase the risk of cardiovascular disease. In 1.15(i), you will interpret total, LDL and HDL cholesterol data; in 1.15(ii), you will examine why the evidence supports a causal contribution from LDL cholesterol. The key is to distinguish the molecule, its carriers and what different kinds of evidence can establish.
Cholesterol and its carriers
Cholesterol is a lipid molecule, whereas LDL and HDL are particles that transport lipids through blood plasma.
Cholesterol
A sterol lipid with four linked carbon rings. It is a component of animal cell membranes and a starting material for steroid hormones and bile acids.
The liver makes cholesterol, and some enters the body from food. Cholesterol has a small water-attracting region, but most of its structure is hydrophobic: it does not dissolve freely in the watery plasma. A lipoprotein packages lipids with proteins so they can travel in this environment. Neither LDL nor HDL is a different chemical variety of cholesterol.
A mature lipoprotein has a hydrophobic core containing triglycerides and cholesteryl esters: cholesterol joined to a fatty acid. Its surface is a single layer of phospholipids, with water-attracting heads facing plasma and hydrophobic tails facing the lipid core. Free cholesterol and proteins called apolipoproteins are also associated with the surface. This arrangement shields the hydrophobic cargo from water. Surface proteins help stabilise the particle and interact with receptors or enzymes, so the particle's composition affects where its cargo goes.
| Feature | Low-density lipoprotein, LDL | High-density lipoprotein, HDL |
|---|---|---|
| Relative composition | More lipid and a lower proportion of protein than HDL | A higher proportion of protein relative to lipid |
| Density | Lower: lipid is less dense than protein | Higher: its larger protein proportion increases density |
| Transport role | Delivers cholesterol to cells; receptors also remove LDL from circulation, especially in the liver | Accepts cholesterol from cells and participates in its return to the liver |
Density does not mean cholesterol concentration in a blood sample. A blood result called LDL cholesterol, or LDL-C, measures cholesterol carried in LDL; HDL cholesterol, or HDL-C, measures cholesterol carried in HDL. These are not direct counts of LDL or HDL particles. Total cholesterol includes cholesterol in all the lipoprotein classes, not just LDL and HDL. These structure and transport distinctions are described in NCBI's lipoprotein reference.
Transport and arterial health
Normal cholesterol transport supplies cells, but prolonged exposure to excess circulating LDL can contribute to atherosclerosis.
LDL binds to receptors on cells and its cholesterol can be taken up and used. Delivering cholesterol is useful: cells need it for membranes and some cells use it to make steroid hormones. Calling all LDL “bad” hides this normal function.
The problem arises when LDL particles enter and are retained in the inner arterial wall. Retained particles can be modified, including by oxidation. Macrophages, cells of the immune system, take up these particles and can become cholesterol-loaded foam cells. Their accumulation and the associated inflammatory response contribute to a plaque. A plaque can narrow an artery, and disruption of its surface can lead to a blood clot. In a coronary artery, reduced or blocked blood flow can deprive heart muscle of oxygen and cause a heart attack. Cholesterol is involved in a biological process within the wall; it is not simply a layer of dietary fat sticking to the blood-facing surface. Tracer research on LDL retention supports this early arterial-wall mechanism.
HDL participates in reverse cholesterol transport. It accepts cholesterol released from cells, including macrophages, and helps transfer it back to the liver. The liver can use cholesterol to make bile acids or secrete cholesterol into bile; elimination occurs when material leaves in faeces. HDL does not directly scrape a plaque away or guarantee that a clot cannot form. Reverse transport provides a plausible protective mechanism, but the cholesterol amount measured in HDL is not a direct measurement of how effectively that process works. Macrophage tracer experiments support the transport pathway in mice; such a model does not by itself establish a reduction in human heart attacks.
LDL delivery and HDL-mediated return are normal transport functions. Excess LDL exposure can promote arterial disease; a high HDL-C measurement alone does not establish effective protection.
The mechanism explains why the carrier matters even though the cholesterol molecule is the same. It also gives a testable prediction: reducing sustained LDL exposure should reduce disease events if LDL is a causal contributor.
Reading cholesterol profiles
The same total cholesterol value can conceal different amounts carried by LDL and HDL.
The following are original illustrative blood profiles, not real patients or clinical thresholds. All cholesterol concentrations are in mmol/L. “Other” includes cholesterol carried by lipoproteins other than LDL and HDL.
| Profile | Total cholesterol | LDL-C | HDL-C | Other cholesterol |
|---|---|---|---|---|
| P | 5.4 | 3.6 | 1.0 | 0.8 |
| Q | 5.4 | 2.6 | 2.0 | 0.8 |
| R | 5.9 | 2.8 | 2.3 | 0.8 |
P and Q have the same total, but Q has less cholesterol in LDL and more in HDL. Given comparable other risk factors, Q's lower LDL-C is consistent with lower risk of atherosclerotic CVD. Its higher HDL-C is also associated with a more favourable risk pattern in many population studies, although it is not proof of protection. Reporting only “both totals are 5.4” would lose biologically relevant information.
R has a higher total than P, but less LDL-C and more HDL-C. It is therefore unsafe to assume that R must have greater risk simply because its total is greater. Total cholesterol is useful population evidence, but a rise mainly in LDL is not biologically equivalent to a rise mainly in HDL. Nor can these three profiles determine overall risk: age, blood pressure, smoking, diabetes, inherited factors and duration of LDL exposure also matter. Lipid data support a qualified comparison, not certainty about an individual's future.
When reading a table, first identify which quantity was measured. Compare like with like in the stated units, then give a conclusion with the relevant values and limits. Do not silently treat total cholesterol as LDL-C, or treat HDL-C as the amount of cholesterol removed per minute.
Scatter diagrams and association
A scatter diagram helps identify whether two measured variables change together across paired observations.
This original simulated dataset represents eight fictional cohorts, each with 1,000 adults initially free of CHD and followed for five years. The lipid values are baseline cohort means; events count adults with a first CHD event during follow-up. Every person in this simulation completes follow-up. The values illustrate analysis, not a measured treatment effect or a clinical risk calculator.
| Cohort | Mean LDL-C / mmol/L | Mean HDL-C / mmol/L | First CHD events per 1,000 adults over five years |
|---|---|---|---|
| A | 1.5 | 1.8 | 20 |
| B | 2.0 | 1.6 | 31 |
| C | 2.5 | 1.7 | 28 |
| D | 3.0 | 1.4 | 46 |
| E | 3.5 | 1.5 | 41 |
| F | 4.0 | 1.2 | 58 |
| G | 4.5 | 1.3 | 55 |
| H | 5.0 | 1.0 | 72 |
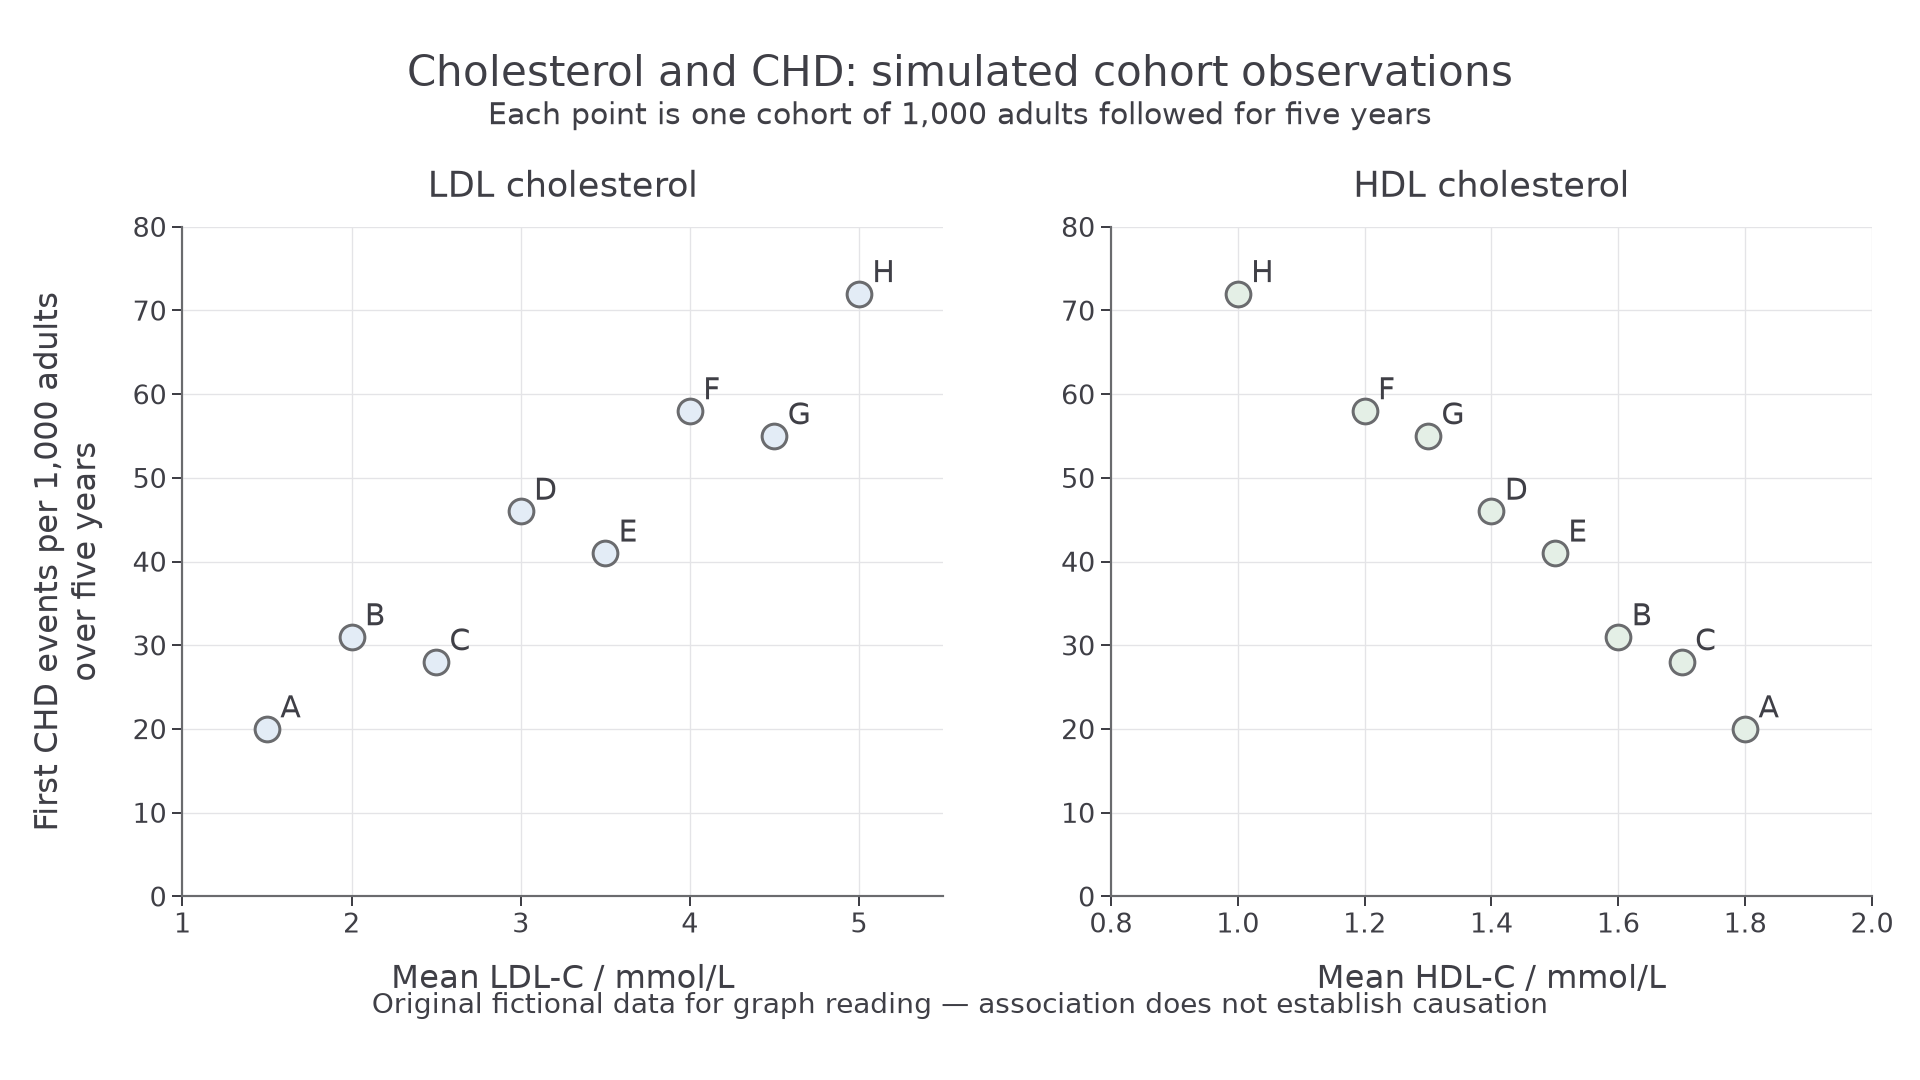
Each labelled point represents one cohort from the complete table. The two panels show the same outcome against different cholesterol measures; neither graph is an intervention.
Read the axis labels and units before the pattern. In the left panel, higher LDL-C is generally associated with more events: this is a positive correlation. For example, A has 1.5 mmol/L and 20 events per 1,000, whereas H has 5.0 mmol/L and 72 events per 1,000. The points follow a fairly close upward pattern, so the association is strong, but not perfect: E has more LDL-C than D yet fewer events. Do not join the points as if cohort E developed from cohort D.
In the right panel, higher HDL-C is associated with fewer events: a negative correlation. H has HDL-C of 1.0 mmol/L with 72 events per 1,000; A has 1.8 mmol/L with 20. Direction describes whether the pattern rises or falls; strength describes how closely points follow a pattern. A steep slope alone does not mean a strong correlation. Visual strength is not a statistical significance test, and no correlation coefficient needs calculating here.
These graphs cannot separate LDL from HDL effects: the cohorts with higher LDL-C also tend to have lower HDL-C. Unmeasured differences such as smoking or blood pressure could influence both the lipid profile and CHD. Such a confounding variable offers another explanation for an association. Cohort means also hide variation among individuals. Thus this dataset supports association, not the claim that changing one individual's HDL-C by a specified amount will prevent a heart attack.
Causal evidence for LDL cholesterol
A causal conclusion is stronger when several independent kinds of evidence support the same prediction and have different limitations.
Prospective studies measure cholesterol before following participants for later disease. They establish that the exposure precedes the outcome and can adjust comparisons for measured factors such as smoking and blood pressure. An analysis of 61 prospective studies found that higher usual total cholesterol was associated with higher mortality from ischaemic heart disease, caused by inadequate blood supply to the heart. Adjustment reduces some confounding but cannot remove every unmeasured influence; observation alone remains insufficient. The association does not imply that every component of total cholesterol contributes equally to disease.
Randomised controlled trials deliberately compare an intervention with a control. Random allocation makes known and unknown pre-existing risk factors similar between groups on average. Comparing otherwise similar care, follow-up and event definitions makes a difference in later events less likely to be explained by those initial factors. Blinding reduces bias in treatment or outcome assessment. Randomisation does not guarantee identical groups, and a drug might have effects besides changing LDL-C, so agreement across interventions and other evidence matters.
In the Lipid Research Clinics trial, 3,806 middle-aged men with high cholesterol were allocated to cholestyramine or placebo; both groups received the same dietary advice. Total and LDL cholesterol fell more in the treatment group. The seven-year incidence of the primary outcome, definite CHD death or non-fatal heart attack, was 7.0% with treatment versus 8.6% with placebo. This is evidence that lowering total cholesterol through lowering LDL-C can reduce CHD events, not that cholesterol explains every event or that this trial alone represents all populations. Original trial report.
A larger Cholesterol Treatment Trialists' analysis combined 26 randomised trials involving about 170,000 participants. Each 1.0 mmol/L LDL-C reduction was associated with about a 22% proportional reduction in major vascular events over the trial follow-up. The consistency across many trials strengthens the evidence, while the size of the effect depends on the outcome and exposure period studied. It is not a 22 percentage-point reduction or an individual prediction. Trial meta-analysis.
Genetic evidence supplies a different comparison. In a 2012 analysis of 312,321 participants, inherited variants associated with lower LDL-C from early life were also associated with lower CHD risk. Genetic allocation is less readily explained by later lifestyle differences or disease changing the cholesterol measurement. The inference still depends on assumptions, including whether a variant affects disease by another pathway. Lifelong lower exposure is different from starting treatment later, so their numerical effect sizes should not be treated as interchangeable. Original genetic analysis.
Mechanistic evidence makes the link biologically credible. LDL can be retained in arterial walls and contribute to foam cells and plaques. Cell studies found defective LDL binding in cells from people with an inherited cholesterol disorder, helping establish the receptor pathway for cholesterol uptake. A cell experiment supports a mechanism, but does not itself measure heart-attack risk. Brown and Goldstein's cell study.
Together, temporal association, intervention, genetics and mechanism support a causal contribution of sustained LDL exposure to atherosclerotic CVD. They also explain why a high total cholesterol level caused mainly by high LDL-C is concerning. This does not make every component of total cholesterol equally harmful, or make LDL the sole cause of all forms of CVD.
HDL and evidence-based claims
An association with lower risk does not show that raising the measured amount of cholesterol in HDL will necessarily reduce disease.
Many observational studies associate higher HDL-C with lower coronary risk, and reverse cholesterol transport offers a plausible explanation. However, HDL-C measures the cholesterol present in HDL at sampling, not the rate of transport out of arterial cells. Lifestyle or metabolic factors can influence both HDL-C and disease risk. HDL particles also vary in function, so increasing their cholesterol cargo need not improve cholesterol removal.
In a 2012 genetic study, a variant raised HDL-C by about 0.14 mmol/L without the lower heart-attack risk expected from the observational association. This challenges the universal claim “any rise in HDL-C causes protection”. It does not show that HDL transport has no biological role, or prove that every way of altering HDL has no effect. Voight and colleagues' primary study.
Reading a health claim
The following is a complete original NovaLearn practice source with fictional observations. It is not a report of a real intervention or Pearson's annual article.
Source A: A marker or a mechanism?
[1] A research team followed 2,000 adults for five years. At the start, adults with higher HDL-C generally experienced fewer later CHD events. These adults also reported more exercise and included fewer smokers. The researchers measured cholesterol carried by HDL; they did not measure cholesterol removal from arterial cells.
[2] A separate team randomly allocated 1,600 adults aged 50–65 to two groups of 800, given a compound or placebo for one year. The compound raised HDL-C, while average LDL-C was similar in the two groups. With complete follow-up, the groups had similar CHD event counts. The study was too short and had too few events to rule out a modest longer-term effect.
[3] A headline stated, “Raising good cholesterol always prevents heart attacks.” The researchers instead called for trials that measure disease outcomes and examine whether HDL function changes, rather than relying only on its cholesterol concentration.
The observational result in paragraph 1 supports an association. Exercise and smoking differences provide specific possible confounders; they are not evidence that the association must be entirely false. Paragraph 2 investigates a change, but its limited duration and event number restrict the conclusion. “Similar counts” is not proof of no effect, particularly without enough evidence to distinguish a small effect from chance variation.
A justified reading rejects the word always in the headline. Neither source guarantees protection, and the short trial cannot settle all HDL interventions. A useful next study would compare comparable randomised groups over a sufficiently long follow-up, measure CHD outcomes, and assess HDL function as well as HDL-C. A biological mechanism and a favourable marker value are reasons to investigate a claim; evidence of changed disease outcomes is needed to test it.
Higher LDL-C has a causal evidence base for atherosclerotic CVD. Higher HDL-C often marks lower risk, but its concentration alone is not proof that raising it will prevent disease. Interpret the measurement, study design and outcome together.