Required practical 9 - Acid-Base Titration Curves
This required practical is about following the whole pH change during a reaction, not just spotting one colour change. By measuring pH after small additions of base, you can compare two titration curves and explain how acid and base strength affect the starting pH, the steepness of the curve, and the pH at the equivalence point.
What This Practical Is Comparing
In both experiments, you begin with a measured volume of acid in a beaker and add an alkali from a burette while monitoring pH with a calibrated probe. A common pair for the first curve is ethanoic acid with sodium hydroxide. A common pair for the second is hydrochloric acid with aqueous ammonia.
Weak acid
A weak acid only partially dissociates in water, so only some of its molecules release ions.
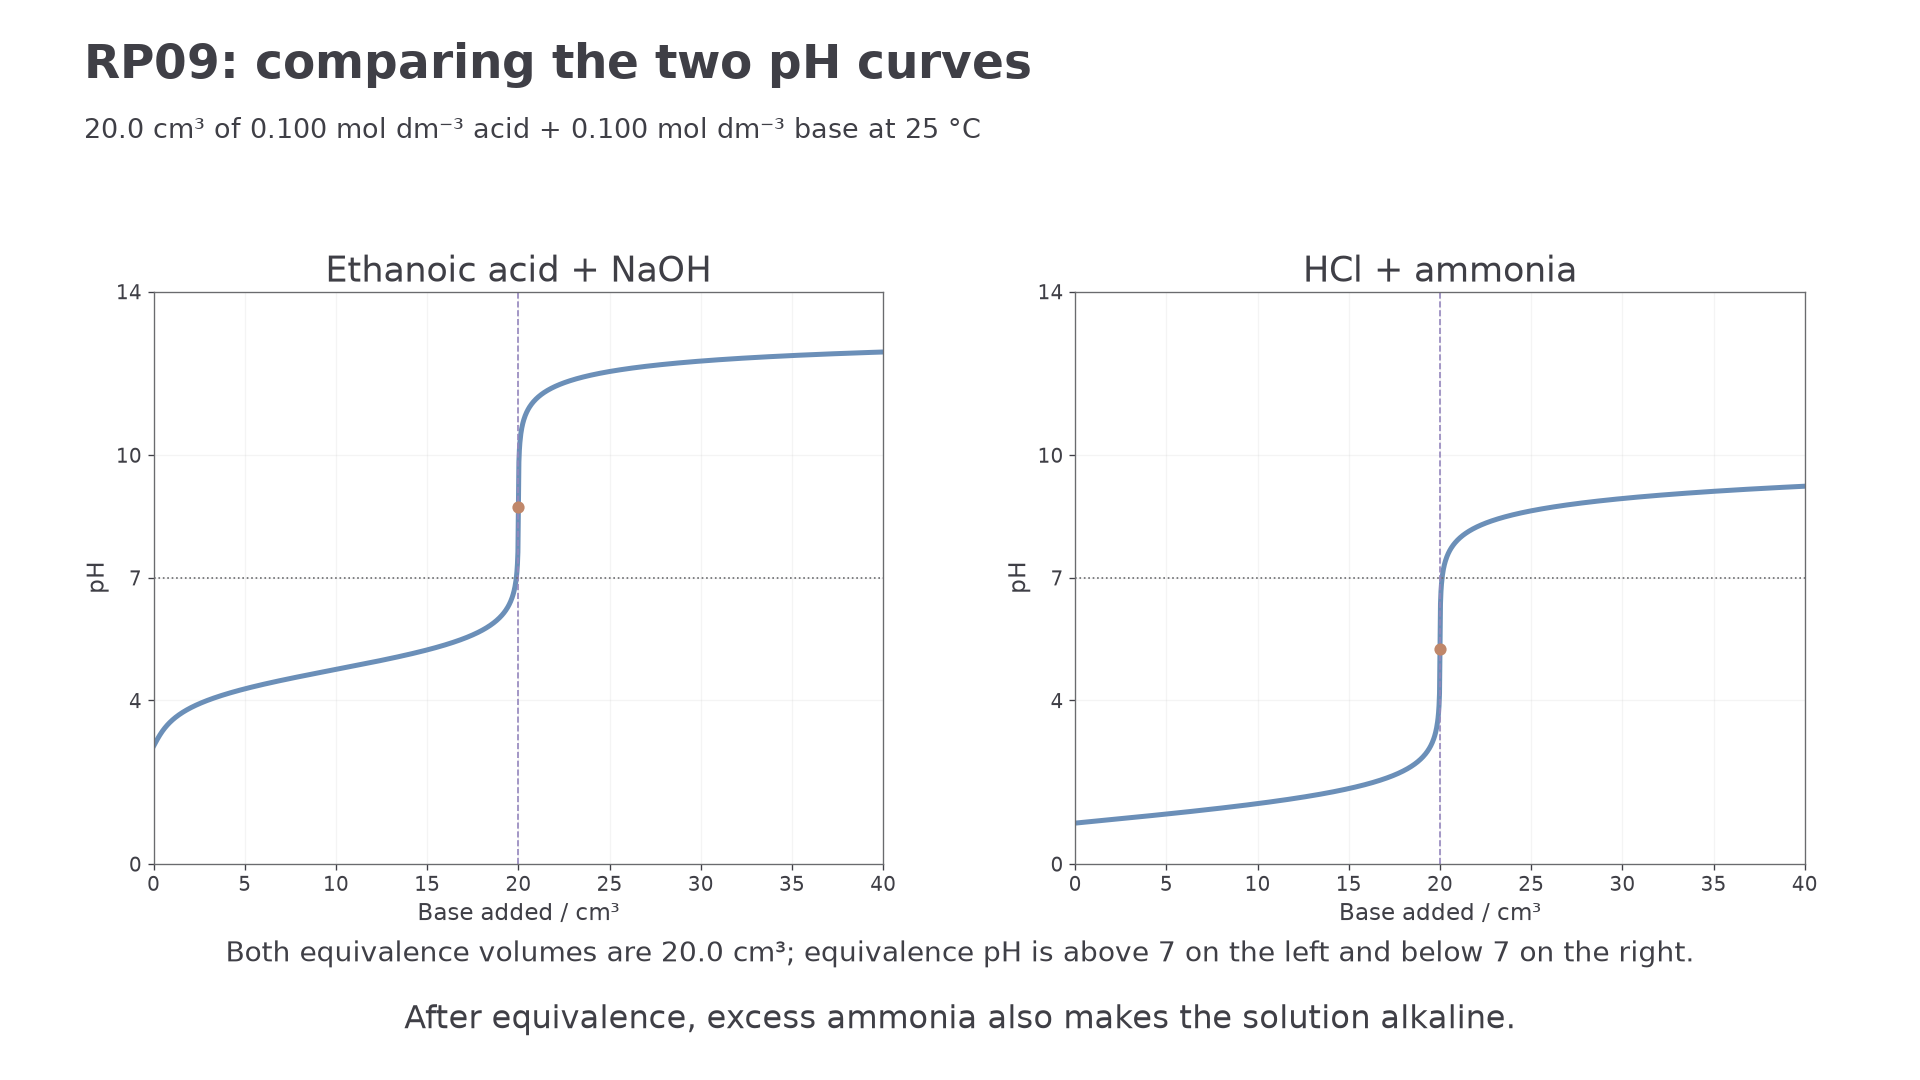
That first definition immediately explains one of the biggest differences between the two curves. A solution of ethanoic acid has fewer free ions than a solution of hydrochloric acid, because hydrochloric acid dissociates essentially completely. So the weak-acid mixture starts at a higher pH than the strong-acid mixture.
Sodium hydroxide is a strong base, so each addition provides ions very effectively. Ammonia is a weak base, so it only partially reacts with water to produce ions. That means equal concentrations do not produce equal changes in pH. Strength matters because it changes how many ions are present in solution, not because it changes how much substance you measured out.
The diagram below compares the two curves investigated in this required practical on matching axes, making the different starting pH values and equivalence-point pH values easy to see.
[DIAGRAM: asset_name: RP 09 - Investigate How pH Changes When a Weak Acid Reacts with a Strong Base and When a Strong Acid Reacts with a Weak Base - Diagram 1; asset_slug: RP 09 - Investigate How pH Changes When a Weak Acid Reacts with a Strong Base and When a Strong Acid Reacts with a Weak Base - Diagram 1; recommended_method: matplotlib_exact_plot; description: Two exact RP09 curves using20mL0.1M acid and0.1Mbase at25C. Ethanoic/NaOH equivalenceabove7; HCl/ammonia below7, with alkaline excess-ammonia tail.]
Collecting Reliable pH Data
To make a fair comparison, you should keep the starting amount and concentration of acid the same in both runs. For example, place of acid in a beaker, immerse the pH probe, and add the base from a burette. Stir gently after each addition so the pH is measured for a uniform mixture rather than a local pocket of reagent.
Before measuring anything, calibrate the pH probe with standard buffer solutions such as pH , , and . Rinse the probe with deionised water between buffers and before putting it into the reaction mixture. This reduces contamination and lets you correct any systematic error in the pH readings.
For the weak-acid/strong-base run, a sensible method is:
- transfer of ethanoic acid to a beaker
- immerse the calibrated pH probe
- record the initial pH
- add portions of sodium hydroxide, stirring and recording pH each time
- switch to much smaller additions, such as , near the steep part of the curve
- continue until the alkali is in excess
For the strong-acid/weak-base run, the logic is the same: use the same starting volume and concentration of hydrochloric acid, then add aqueous ammonia in measured portions and record the pH after each addition. Keeping concentration, temperature, and volume pattern as similar as possible makes the comparison more meaningful.
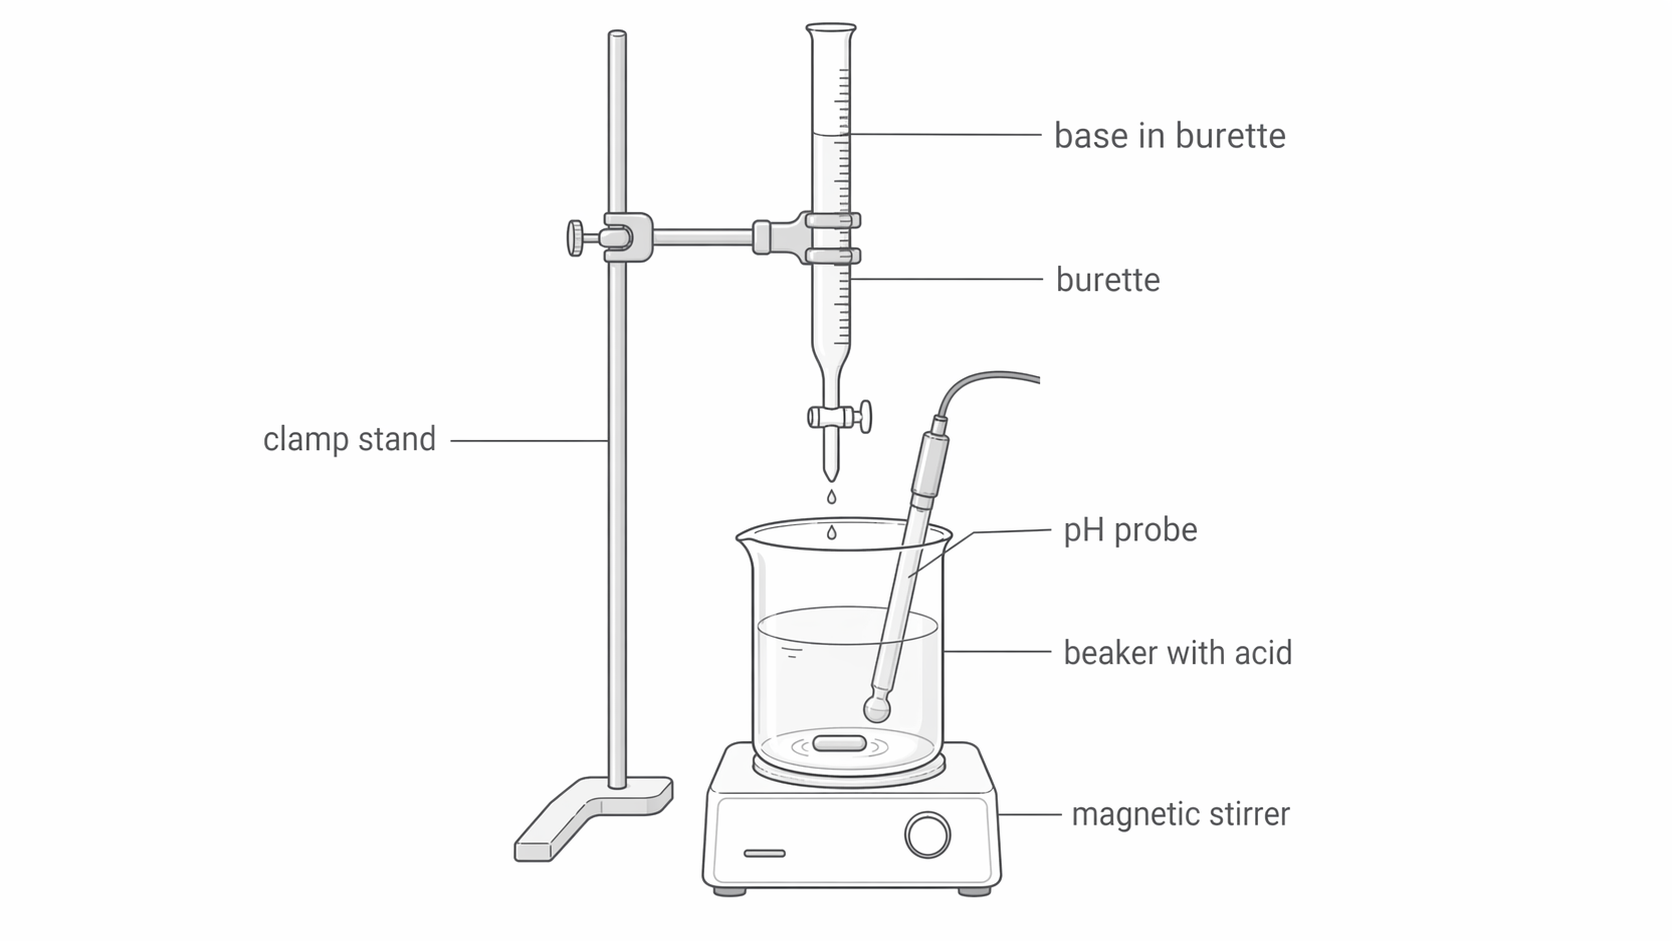
The diagram below shows one suitable arrangement for collecting the pH data while the alkali is added in measured portions.
[DIAGRAM: asset_name: RP 09 - Investigate How pH Changes When a Weak Acid Reacts with a Strong Base and When a Strong Acid Reacts with a Weak Base - Diagram 2; asset_slug: RP 09 - Investigate How pH Changes When a Weak Acid Reacts with a Strong Base and When a Strong Acid Reacts with a Weak Base - Diagram 2; recommended_method: retained_png; description: Practical setup showing a burette clamped to a stand above a beaker containing acid on a magnetic stirrer, with base delivered from the burette into the beaker and a pH probe angled into the solution so its bulb is fully immersed. Show a realistic school-laboratory arrangement with a drop falling from the burette tip. Label base in burette, burette, clamp stand, beaker with acid, pH probe, and magnetic stirrer.]
A short calculation helps you predict where the steep section should appear. If of ethanoic acid is used, the amount of acid is:
Ethanoic acid reacts with hydroxide ions in a 1:1 ratio, so the equivalence point needs of . If the sodium hydroxide is also , the required volume is:
That is why smaller additions should be used around in this example. The same 1:1 logic also helps you plan the strong-acid/weak-base run.
Rinse the pipette with the acid and use a pipette filler to transfer the chosen aliquot. Rinse and fill the burette with the base, fill its jet, remove the filling funnel and record the initial reading at eye level. Calibrate the pH meter with appropriate reference buffers, rinse the probe with deionised water between mixtures and gently blot without rubbing. Keep the bulb immersed, mix gently and wait for a stable reading after each measured addition. A trial run locates the steep region; a repeat run uses much smaller additions there. Keep temperature, acid amount, base concentration and measurement procedure controlled for a useful comparison. Adding a little water to immerse the probe changes concentrations and starting pH, so record it and use the same planned volume in comparisons.
Continue this lesson.
You’re previewing NovaLearn without an account. Create a free account to read the rest.
Create free account