3.3.15 - Nuclear Magnetic Resonance Spectroscopy
Nuclear magnetic resonance (NMR) spectroscopy helps chemists work out where different carbon and hydrogen atoms sit inside an organic molecule. On its own, one NMR spectrum rarely gives the whole answer, but when you combine NMR, NMR, chemical shift, integration, and splitting, the structure starts to come into focus. In this lesson, we will turn NMR into a repeatable method rather than a list of facts.
What NMR Tells You
Chemists do not usually confirm a new organic structure with a single test. They combine evidence from several analytical techniques, and NMR is one of the most powerful because it tells you about atomic environments inside the molecule itself.
Here, focus on interpreting spectra rather than on the instrument physics. The key idea is simple: atoms in different molecular environments absorb slightly different amounts of energy, so they appear at different positions on a spectrum. A NMR spectrum tells you about carbon environments. A NMR spectrum tells you about hydrogen environments.
Chemical environment
Atoms are in the same chemical environment if they are surrounded in the same way by the same groups of atoms. Atoms in the same environment produce one NMR signal.
NMR is simpler than NMR. There are usually fewer carbon environments than hydrogen environments in a molecule, and at this level spectra are mainly used for the number of peaks and their positions. The spectra used here are proton-decoupled, so splitting caused by neighbouring nuclei is removed. The low natural abundance of (about 1%) also makes coupling between neighbouring nuclei unlikely. In NMR, you also have to interpret integration and spin-spin splitting, so there is more information to process.
The x-axis is labelled on the scale in parts per million, ppm. A peak further to the left has a larger value. That happens when the nucleus is more deshielded by its molecular environment, often because it is close to an electronegative atom or inside a strongly electron-withdrawing functional group.
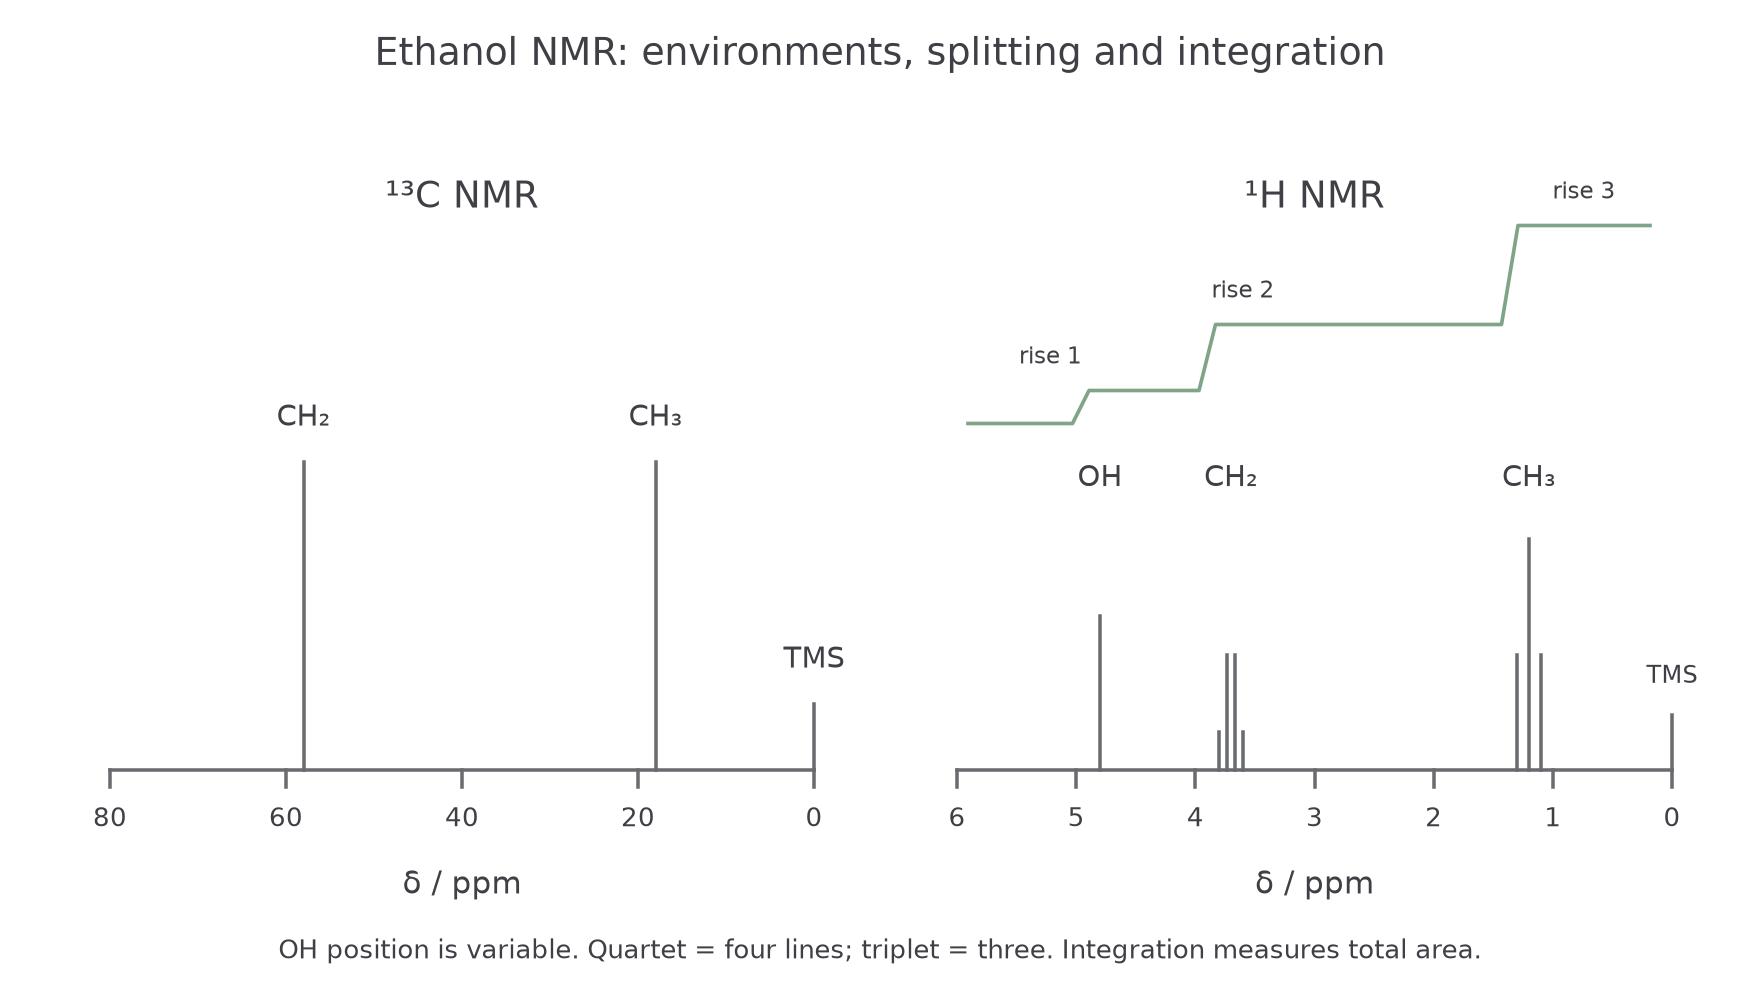
The diagram below compares the much simpler spectrum of ethanol with the richer spectrum, where TMS marks and the integration trace and splitting give extra structural clues.
[DIAGRAM: asset_name: 3.15 - Nuclear Magnetic Resonance Spectroscopy - Diagram 1; asset_slug: 3.15 - Nuclear Magnetic Resonance Spectroscopy - Diagram 1; recommended_method: code_generated; description: Ethanol spectra: two 13C signals near 58 and 18 ppm; 1H OH singlet, four-line CH2 quartet and three-line CH3 triplet, correct 1:2:3 integration rises, TMS at zero and reversed delta axes.]
Reading 13C NMR
NMR is often the cleanest place to start because it answers two useful questions quickly:
- How many different carbon environments are there?
- What types of carbon environments are they likely to be?
Each peak represents one carbon environment, not one carbon atom. If a molecule has symmetry, several carbon atoms can share the same environment and give only one signal.
For example, ethanol, , gives two peaks because it has two carbon environments: one carbon in and one carbon in . Propanone, , also gives only two peaks even though it has three carbon atoms, because the two groups are equivalent.
Chemical shift
Chemical shift is the position of an NMR signal on the scale, measured in ppm relative to a standard. It shows how shielded or deshielded a nucleus is in its molecular environment.
To interpret a spectrum, use the Chemistry Data Booklet to match broad regions rather than trying to memorise every exact number. What matters most is recognising the pattern:
- around : alkyl carbons
- around : carbons attached to oxygen in alcohols, ethers, or esters
- around : carbonyl carbons, with aldehydes and ketones furthest downfield
Tetramethylsilane, , is used as the standard. It is suitable because:
- all its carbon atoms and all its hydrogen atoms are in identical environments, so it gives one sharp signal
- silicon is less electronegative than carbon, so its nuclei are highly shielded and its signal is away from most organic peaks; the TMS reference signal is assigned
- it is chemically inert
- it is volatile, so it can be removed easily after analysis
When you see a peak far to the left, think "deshielded carbon", often close to oxygen or part of a group. When you see only a small number of peaks, always check whether symmetry could explain it.
Reading 1H NMR - Shift, Integration, and Solvents
NMR uses the same basic idea, but now every signal comes from a hydrogen environment. The position of each signal again depends on shielding, so the Data Booklet helps you link a value to a likely proton environment.
Some useful anchors are:
- about : protons in simple alkyl groups
- about : protons next to a carbonyl group
- about : protons on carbons bonded to oxygen or halogen
- about : aldehyde proton
- about : carboxylic acid proton
Do not treat these numbers as exact labels. A signal does not identify a structure by itself; it suggests a possible environment. You confirm that idea using the other NMR evidence.
In NMR, the area under a signal matters. Instruments usually show this with an integration trace.
Integration
Integration is the measurement of the relative area under each NMR signal. It shows the relative numbers of protons in each hydrogen environment.
If the integration ratio is , that does not prove the molecule contains exactly eight hydrogens. It tells you the proton environments are present in the relative ratio . You still need the molecular formula or other evidence to convert that into a full structure.
Worked example: suppose a spectrum has three signals with integration ratio .
- one environment contains six equivalent protons
- one environment contains one proton
- another environment contains one proton
That pattern is often seen in compounds such as propan-2-ol, where two equivalent groups provide the , one proton provides one , and the proton provides the other .
NMR spectra are usually run using samples dissolved in deuterated solvents such as , or in . Ordinary hydrogen-containing solvents would produce their own strong signals and swamp the peaks from the compound you are trying to analyse.
To read a stepped integration trace, measure each rise, not its absolute height above the baseline. Rises of 12, 18 and 18 arbitrary units reduce to ; with eight H atoms in the molecular formula, these represent 2H, 3H and 3H. OH chemical shift and splitting can vary with solvent and exchange, so do not force OH into a fixed position or an ordinary neighbouring-carbon splitting rule. Deuterium is , not , so it does not contribute a normal proton signal at the frequency used.
Continue this lesson.
You’re previewing NovaLearn without an account. Create a free account to read the rest.
Create free account