3.3.6.3 - Infrared Spectroscopy
Infrared spectroscopy is useful because it turns invisible bond vibrations into evidence we can read. In this lesson, you will learn how to scan an IR spectrum for key absorptions, use the Chemistry Data Sheet or Booklet to suggest functional groups and possible structures, use the fingerprint region to compare samples and spot impurities, and connect the same bond-absorption idea to global warming.
What an IR spectrum shows
When infrared radiation passes through a sample, particular bonds absorb radiation whose frequency matches one of their vibrations. Different bonds absorb at different characteristic wavenumbers, so the spectrum gives clues about which bonds are present in the molecule.
Wavenumber
Wavenumber is the number of waves per centimetre, measured in . In IR spectroscopy it is used instead of wavelength, and each bond absorbs over a characteristic wavenumber range.
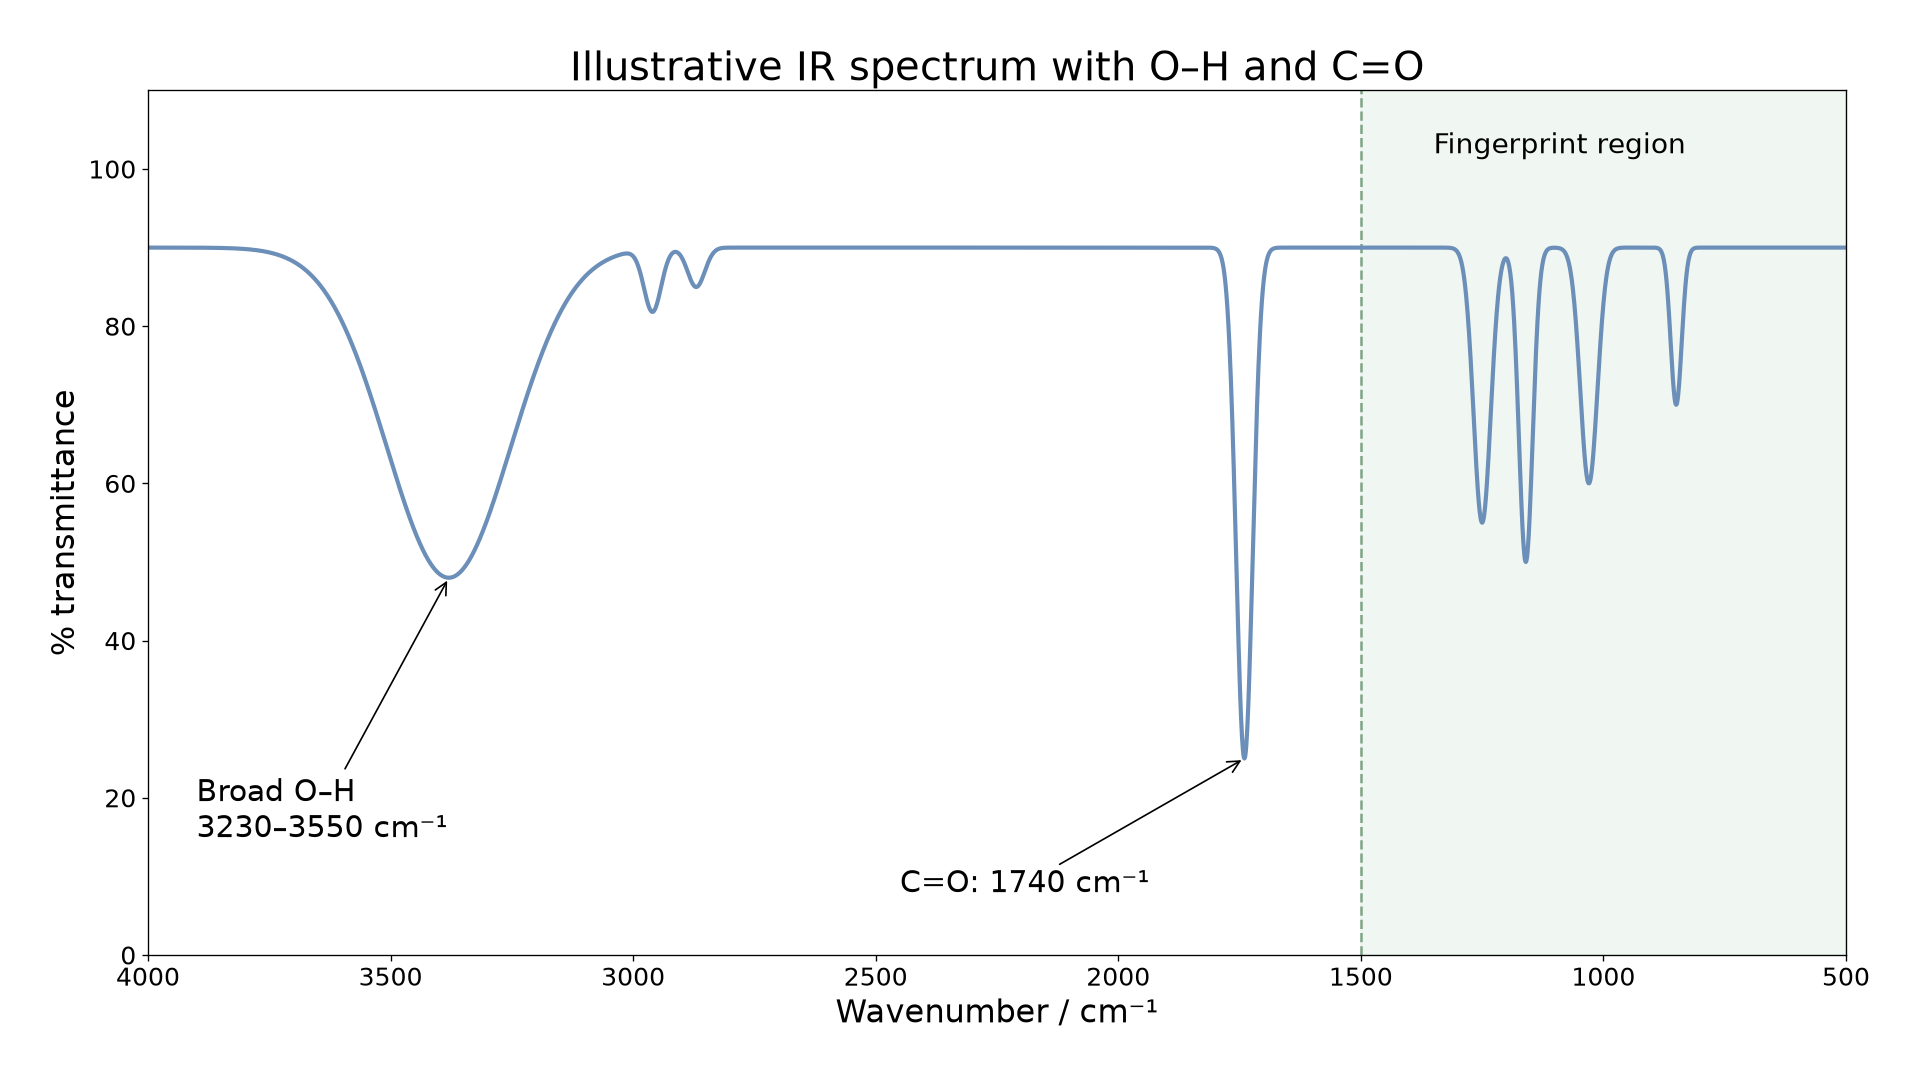
Most school spectra are plotted as transmittance against wavenumber. The x-axis runs from high wavenumber on the left to low wavenumber on the right, so it moves in the opposite direction to many other graphs. A downward trough shows that radiation at that wavenumber has been absorbed by the sample.
The diagram below shows a typical IR spectrum and highlights the broad absorption, the strong absorption, and the fingerprint region below about , which is used for matching once the main absorptions have been read.
[DIAGRAM: asset_name: 3.6.3 - Infrared Spectroscopy - Diagram 1; asset_slug: 3.6.3 - Infrared Spectroscopy - Diagram 1; recommended_method: retained_png; description: Typical infrared spectrum with a smooth transmittance trace, y-axis labelled % transmittance, and x-axis labelled wavenumber / cm^-1 decreasing from 4000 on the left to 500 on the right. Show a broad O-H trough across 3230-3550 cm^-1, a strong sharp C=O trough near 1740 cm^-1, and the region below 1500 cm^-1 lightly shaded and labelled fingerprint region.]
Do not start by chasing every small feature in order. Start with the biggest, clearest absorptions, because those usually identify the most useful bonds first.
Using the data sheet to identify functional groups
Use the Chemistry Data Sheet or Booklet to match the observed absorptions to the printed ranges, then combine those clues logically. IR usually identifies bonds and functional groups first; only after that do you start suggesting whole structures.
A useful read-the-spectrum sequence is:
- Use the molecular formula, if given, to limit the possible structures.
- Look for broad absorptions such as .
- Look for a strong absorption.
- Check for other useful ranges such as , , or .
- Use missing absorptions to rule out groups as well as using present ones to suggest groups.
A vibration absorbs IR when it changes the molecular dipole moment. Some symmetrical vibrations are weak or inactive, so an absent peak alone is not an absolute proof that a bond cannot exist. In these structured exercises, use all the supplied evidence, especially molecular formula and candidate structures.
Some especially useful clues are:
- always match them to the exact ranges printed in the Chemistry Data Sheet or Booklet you have in front of you
- broad suggests in an alcohol or phenol
- very broad suggests in a carboxylic acid
- suggests in amines
- strong suggests
- can suggest
- can suggest
Suppose a compound with molecular formula has a strong absorption at , another absorption in the region, and no broad absorption. The absorption points to , while the absorption suggests . Because there is no broad , a carboxylic acid or alcohol is unlikely. A structure consistent with all of that evidence is an ester, such as methyl ethanoate.
This same logic helps when two candidates share a carbonyl peak. For example, ethanoic acid and methyl methanoate both fit and both contain , but only the acid should show the very broad absorption. If that broad peak is absent, rule out the carboxylic acid.
IR does have limits. A strong absorption tells you a carbonyl is present, but it does not by itself tell you the exact carbonyl compound. Several molecules can share the same obvious functional-group peak. That is why IR lets you suggest possible structures rather than always proving a unique one from the main peaks alone.
Continue this lesson.
You’re previewing NovaLearn without an account. Create a free account to read the rest.
Create free account