Required practical 12 - Thin-Layer Chromatography
This required practical is about more than making spots appear on a plate. You are using thin-layer chromatography, or TLC, to separate the components in a mixture and then identify them by comparing the pattern with known standards. The important habit is to connect the method to the chemistry: why different substances travel different distances, why the setup must be controlled carefully, and how values help turn a chromatogram into evidence.
Why A TLC Plate Separates A Mixture
Thin-layer chromatography works because the substances in a mixture do not all behave in the same way as the solvent moves up the plate. A TLC plate is coated with a thin layer of a solid such as silica, which acts as the stationary phase. The solvent is the mobile phase. As the solvent rises up the plate by capillary action, the dissolved substances repeatedly split their time between moving with the solvent and sticking to the stationary phase.
Thin-layer chromatography
Thin-layer chromatography is a separation technique in which a mixture is carried by a solvent over a solid stationary phase on a flat plate.
If a substance is more soluble in the mobile phase, it tends to travel further up the plate. If it is more strongly attracted to the stationary phase, it is held back and travels a shorter distance. That balance lets very similar substances separate into different spots.
This is why TLC is useful for analgesics. A painkiller tablet may contain one active compound or a mixture such as aspirin, caffeine, or paracetamol. When the dissolved sample is placed on the plate beside known standards, the number and positions of the spots give evidence about what is present. A pure substance usually gives one spot under a given set of conditions, while a mixture gives more than one.
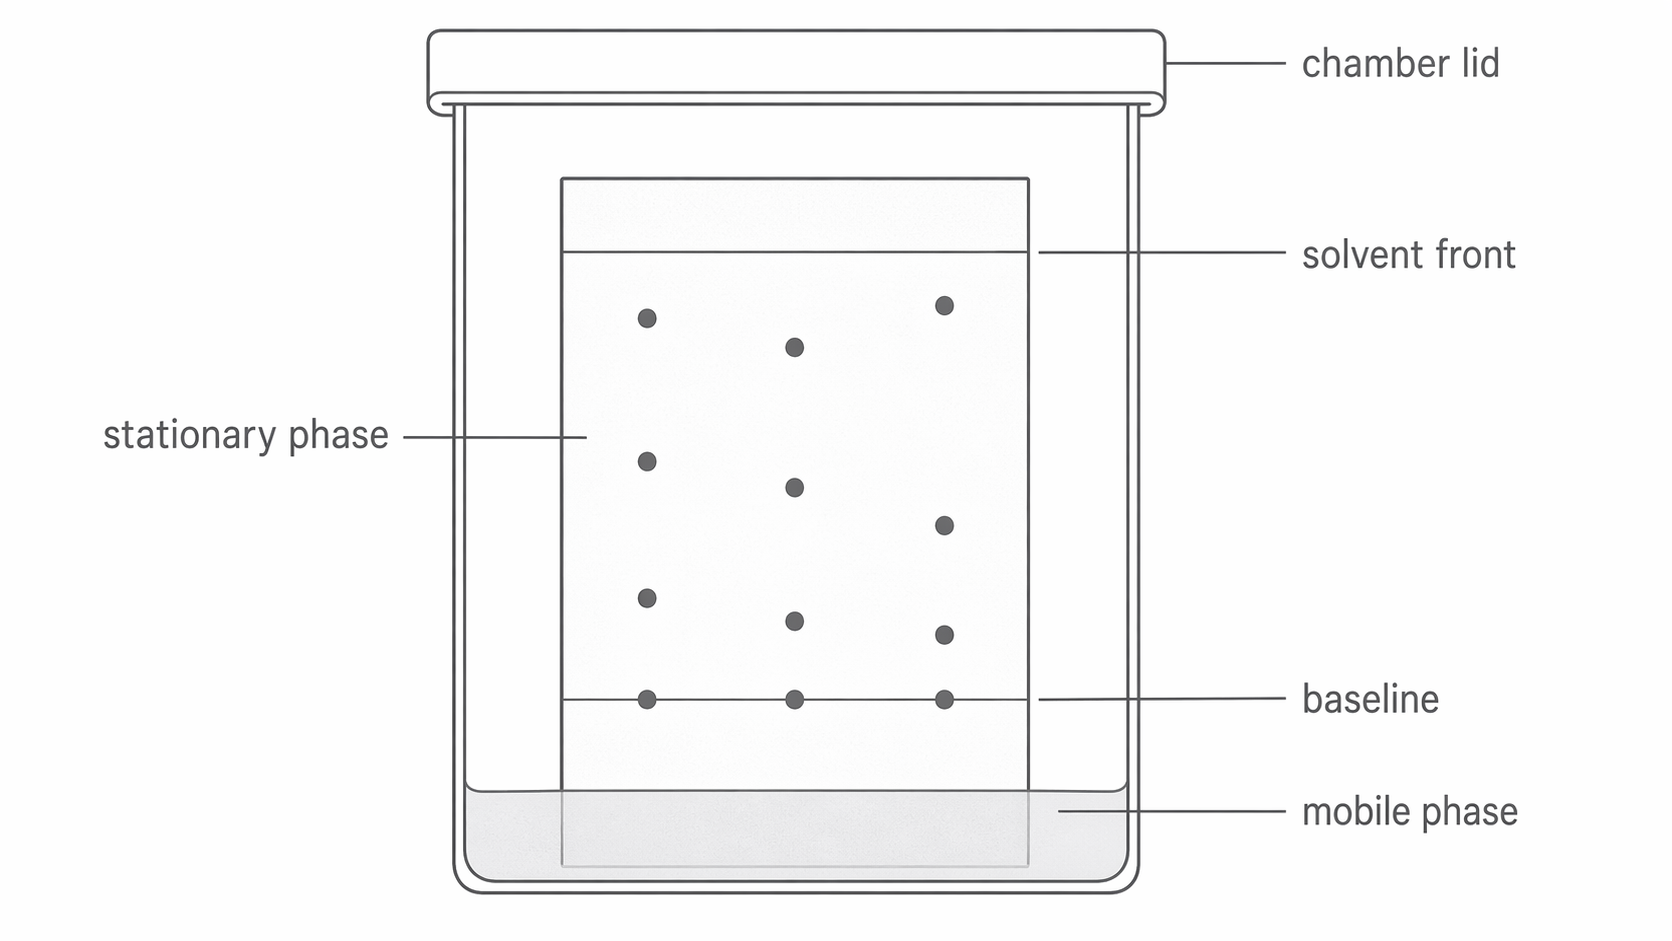
The diagram below shows the essential TLC setup in a sealed chamber, including the baseline above the solvent and the separated spots forming as the mobile phase rises.
[DIAGRAM: asset_name: RP 12 - Separation of Species by Thin-Layer Chromatography - Diagram 1; asset_slug: RP 12 - Separation of Species by Thin-Layer Chromatography - Diagram 1; recommended_method: retained_png; description: TLC plate developing in a sealed chamber. Show a covered chamber with solvent at the bottom, a silica-coated plate standing vertically, a pencil baseline above the solvent level, three small starting spots on the baseline, and separated spots at different heights higher up the plate as the solvent rises. Label the stationary phase on the plate, the mobile phase in the solvent reservoir, the baseline, the solvent front, and the chamber lid.]
Running The Practical So The Separation Is Clean
For an analgesic sample, the tablet is first crushed and dissolved in a suitable solvent such as ethanol. Small samples of the standard solutions and the unknown sample are then placed on the TLC plate using capillary tubes.
The practical details matter because a poor setup can ruin the chromatogram before the chemistry has a chance to separate anything. Draw the baseline in pencil, not ink, because pencil graphite does not dissolve in the solvent. The baseline should be above the solvent level in the chamber. If the solvent starts above the spots, the samples dissolve straight into the solvent reservoir instead of travelling up the plate in a controlled way.
Solvent front
The solvent front is the furthest point reached by the solvent on the chromatogram.
Each spot should be tiny but concentrated. A large wet spot spreads sideways and can merge with neighbouring spots, so the final chromatogram becomes blurred and hard to interpret. If a stronger spot is needed, it is better to let a small spot dry and then add another tiny drop on the same origin point.
The chamber should be covered with a lid while the chromatogram develops. This reduces solvent evaporation and helps the atmosphere inside the chamber become saturated with solvent vapour, which improves the quality and consistency of the separation. When the solvent front is close to the top of the plate, remove the plate and mark the solvent front immediately in pencil before the solvent evaporates. Then dry the plate, often in a fume cupboard, and use a UV lamp if the spots are colourless.
Safety is built into the method. Wear eye protection and gloves, because the solvent may be irritant, toxic, or flammable depending on what is used. The lid and the fume cupboard both reduce exposure to solvent vapour. Gloves also help prevent contamination from your hands reaching the plate.
If the substances are colourless, the UV lamp makes the spots visible so they can be circled lightly in pencil before measuring. Some transition metal ions are coloured already, so in that context the spots may be easier to see directly.
Filter the tablet extract if insoluble binders remain. Use a fresh capillary for each standard and sample to prevent cross-contamination, handle the plate by its edges and keep the starting spots at the same height. Use a shielded UV viewing cabinet and avoid exposing eyes or skin directly to UV. Choose solvent-specific controls from the risk assessment; keep flammable solvents away from ignition sources. Record the solvent composition, plate type, temperature and locating method so a comparison can be repeated.
Turning A Pattern Of Spots Into An Identification
Seeing spots is only the first stage. To identify a substance, you compare the distance travelled by each spot with the distance travelled by the solvent front. Both distances are measured from the baseline.
Rf value
An value is the ratio of the distance moved by a substance to the distance moved by the solvent front on a chromatogram.
The calculation is:
Rf value
Because a spot cannot move beyond the solvent front, lies between and , inclusive. It has no units; a spot at the baseline has and one at the solvent front has . A larger means the substance travelled relatively further, so under those conditions it had a greater tendency to move with the mobile phase and a weaker attraction to the stationary phase.
Worked example: the solvent front travels . An unknown sample produces spots at and from the baseline.
- first spot:
- second spot:
Continue this lesson.
You’re previewing NovaLearn without an account. Create a free account to read the rest.
Create free account