3.1.5.3 - Effect of Temperature on Reaction Rate
Temperature is one of the quickest ways to change how fast a chemical reaction happens. The interesting part is that a small rise in temperature can make a reaction speed up far more than you might expect. That happens because temperature does much more than simply make particles move faster.
What rate of reaction means
A reaction is fast when reactants are being used up quickly or products are being formed quickly. It is slow when those changes happen only gradually.
Rate of reaction
The rate of reaction is the change in concentration of a reactant or product per unit time.
That definition is more precise than saying that rate is just "how quickly a reaction goes." For example, if a gas is produced rapidly, the amount of gas collected rises quickly in a short time. If a reactant concentration drops only a little over the same time, the rate is lower.
When temperature increases, particles in gases and solutions gain kinetic energy. They move faster, so they collide more often. That does help to increase rate, but it is only part of the explanation. The more important change is that a larger fraction of particles now has enough energy for collisions to lead to reaction.
Activation energy and effective collisions
Collisions alone do not guarantee a reaction. Particles may hit each other and simply separate again if the collision is not energetic enough to begin bond breaking.
Activation energy
The activation energy, , is the minimum energy that colliding particles must have for a reaction to occur.
A collision that does produce reaction is called a successful or effective collision. Some reactions also require the particles to meet in a suitable orientation, but here particles must also have energy greater than or equal to .
The diagram below compares an unsuccessful collision with an effective collision.
[DIAGRAM: asset_name: 1.5.3 - Effect of Temperature on Reaction Rate - Diagram 1; asset_slug: 1.5.3 - Effect of Temperature on Reaction Rate - Diagram 1; recommended_method: retained_png; description: Before, collision and after stages distinguish unsuccessful low-energy collisions from successful sufficiently energetic collisions.]
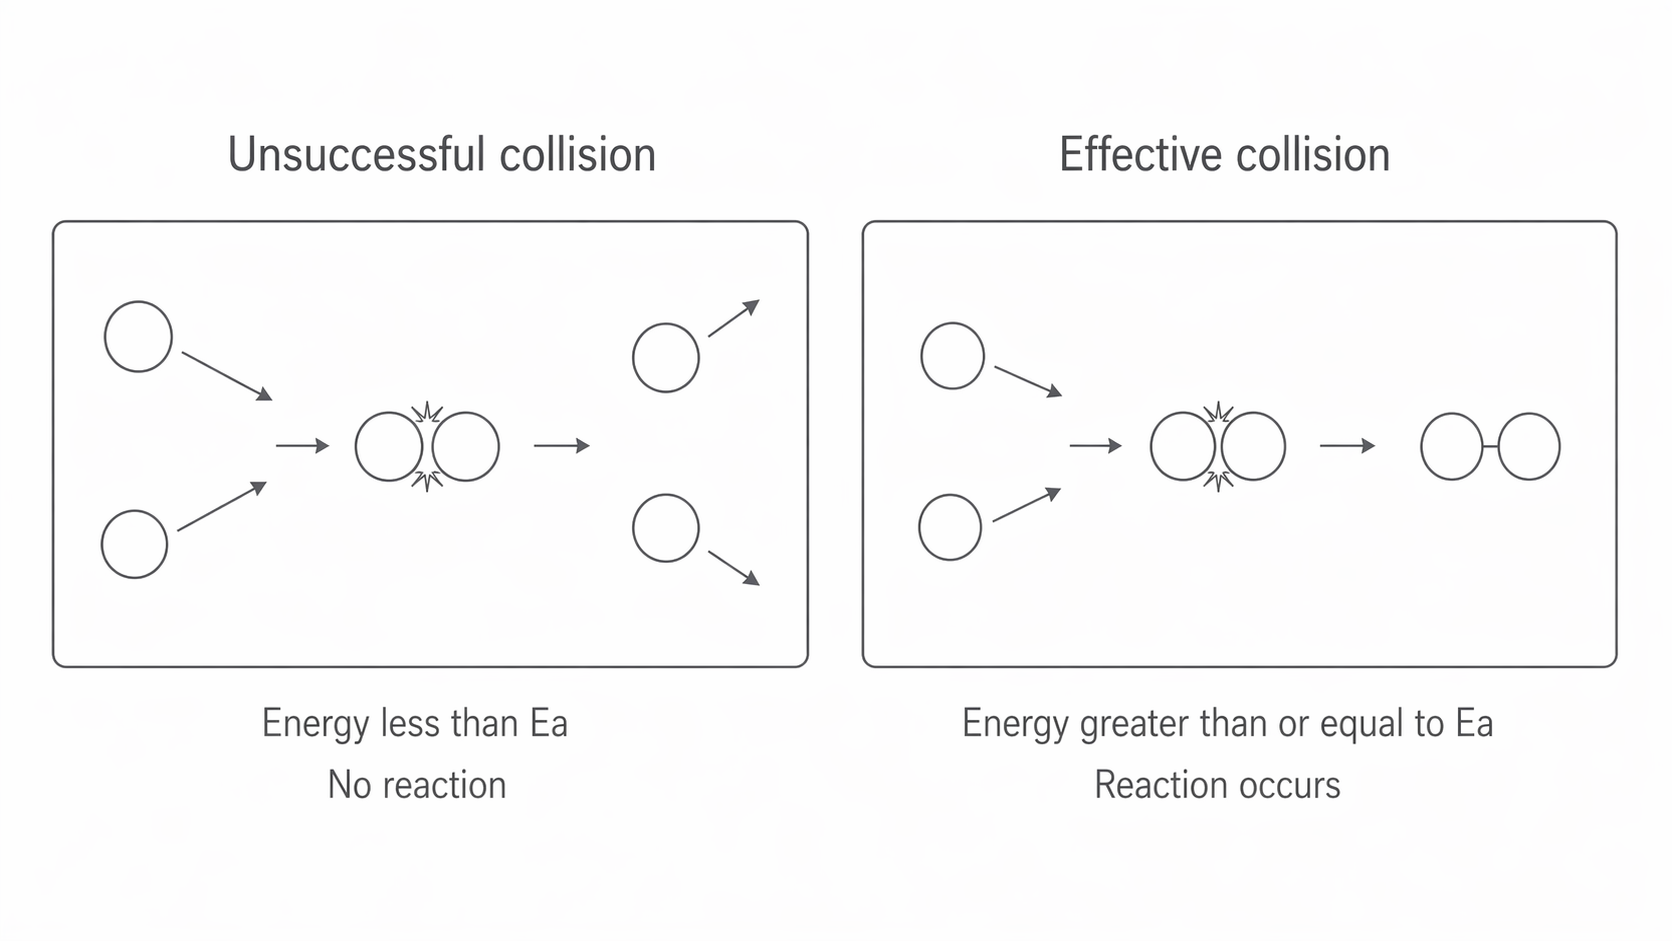
The energy comparison assumes a suitable collision orientation. Enough energy is necessary; molecules must also align their reacting parts for the collision to succeed.
As temperature rises, average particle energy rises as well. This means collisions happen slightly more often because the particles are moving faster, and a greater proportion of collisions are energetic enough to be effective. That second effect is the one that matters most when explaining why rate increases so much.
Using the Maxwell-Boltzmann distribution
To see why temperature has such a large effect, chemists use the Maxwell-Boltzmann distribution. This graph shows how particle energies are spread out in a sample.
On this graph, the x-axis is energy and the y-axis is the number of molecules, or fraction of molecules, with that energy. Most particles have intermediate energies near the peak. Only a small fraction has very high energy. The total area under the curve stays the same because the total number of particles has not changed.
If a vertical line is added for , only the area to the right of that line represents particles with enough energy to react.
The diagram below shows how the Maxwell-Boltzmann distribution changes when the temperature is increased.
[DIAGRAM: asset_name: 1.5.3 - Effect of Temperature on Reaction Rate - Diagram 2; asset_slug: 1.5.3 - Effect of Temperature on Reaction Rate - Diagram 2; recommended_method: deterministic_code; description: Equal-number distributions at two temperatures; the hotter distribution has a lower broader peak and a larger fraction above activation energy.]
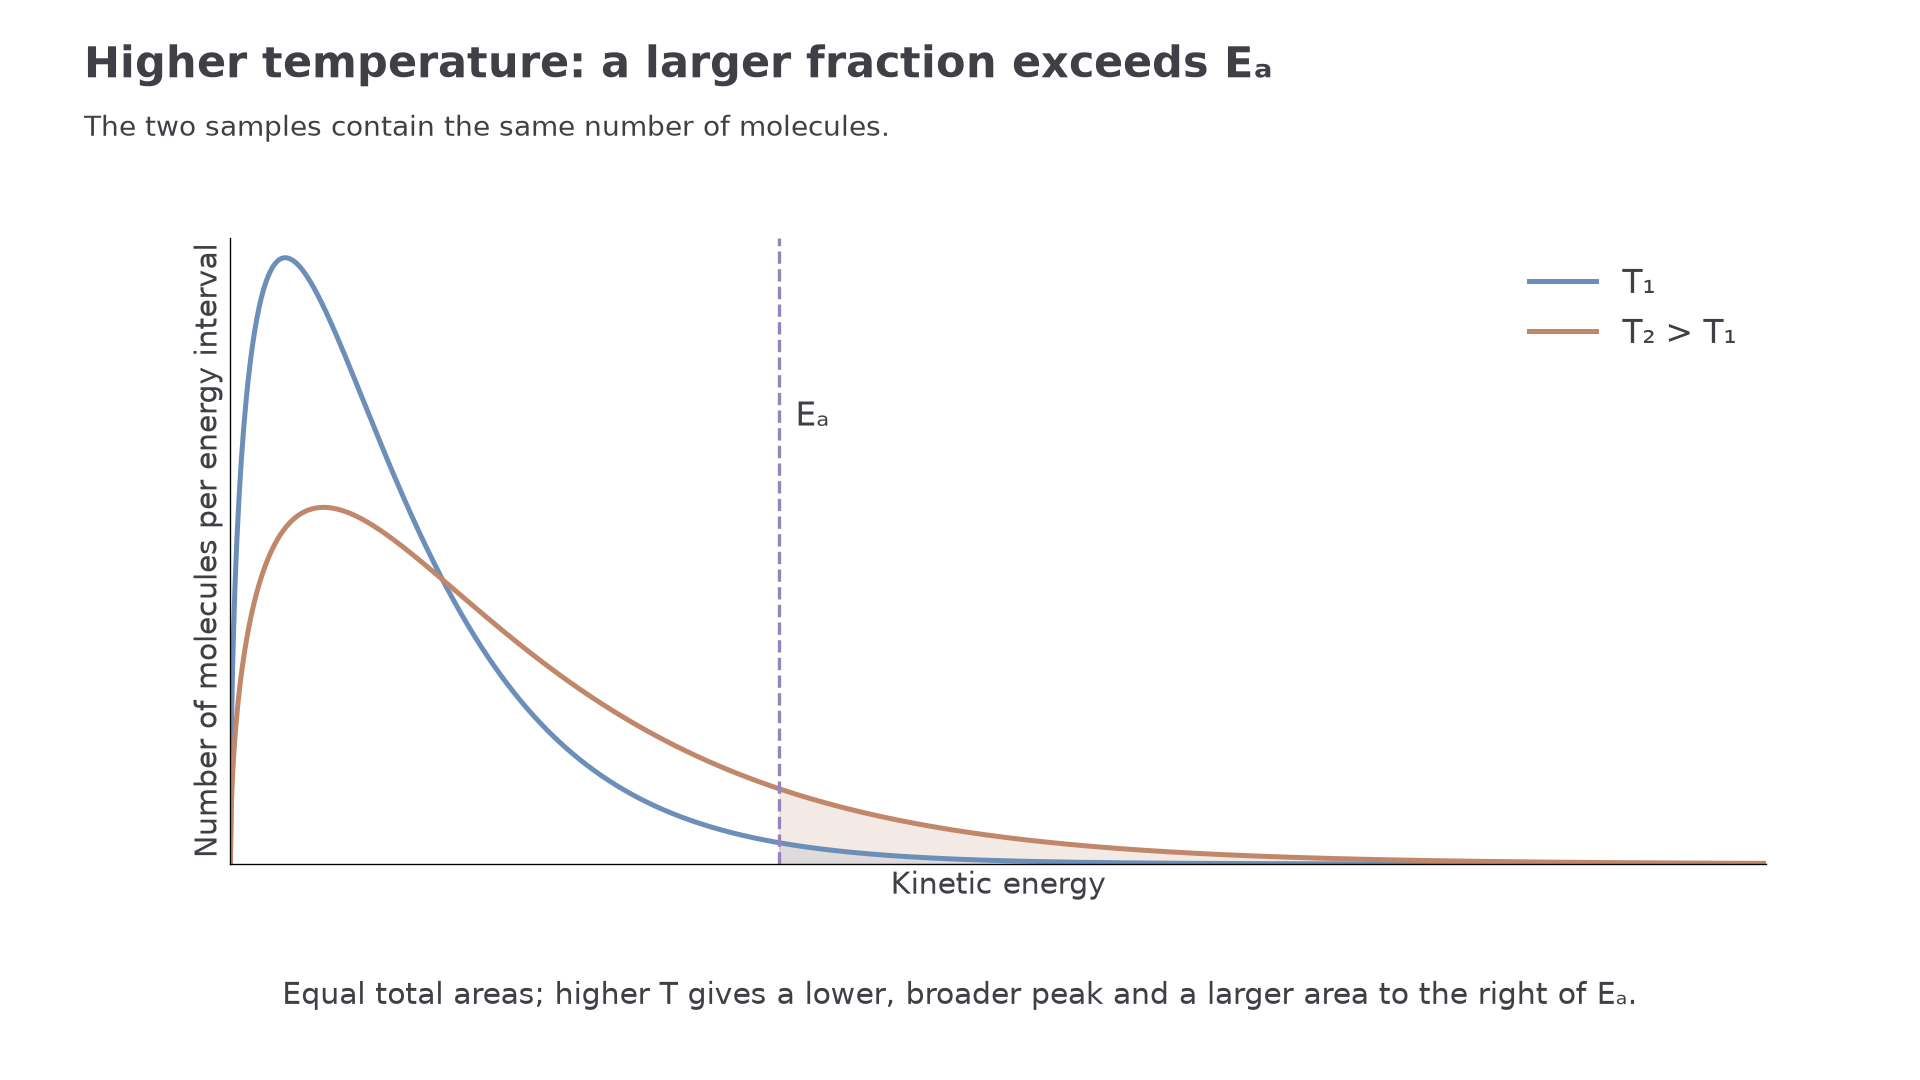
When temperature increases, the curve becomes lower and broader, and its peak shifts to the right. The activation energy line does not move, because is a property of the reaction itself, not of the temperature chosen for the sample.
Worked example: suppose the line lies well out in the high-energy tail of the graph. At the lower temperature, only a small shaded region lies beyond . At the higher temperature, the curve has shifted enough that the shaded region becomes much larger. So a modest change in the graph creates a large change in the number of particles able to react.
Connecting temperature to measured rates
The activation energy line usually sits in the high-energy tail of the Maxwell-Boltzmann distribution, where only a relatively small number of particles are found. A small increase in temperature shifts more particles into that tail region, so the number of particles with energy greater than or equal to increases by a large proportion.
That means the number of effective collisions each second rises sharply. There is also a small increase in collision frequency because particles are moving faster, but that is not the main reason the rate increases so much. The larger change is that many more particles can now overcome the activation energy barrier.
Cooling shows the same idea in reverse. At lower temperature, the distribution shifts left, so fewer particles have enough energy to react. The reaction slows because there are fewer effective collisions per second.
Food is kept in a refrigerator because many reactions that cause spoilage happen more slowly at lower temperature. The particles still collide, but a smaller fraction of them has enough energy to overcome , so the rate drops.
To test this prediction, compare the time taken to form the same small amount of product at different temperatures. If that fixed endpoint takes 80 s at one temperature and 40 s at another, the relative rate doubles from 0.0125 to 0.0250 s⁻¹. This is a relative rate, not a concentration rate in mol dm⁻³ s⁻¹; it works only when the same amount of reaction gives the endpoint each time.
Bring both reactant solutions to the chosen temperature before mixing, measure the actual mixture temperature, and hold concentrations and total volume constant. Otherwise a changing dilution or a mixture that cools rapidly may be mistaken for a temperature effect. Required Practical 3 develops this comparison with repeats and uncertainty. There is no universal rule that every reaction doubles in rate for each 10 °C rise; the size of the change depends on its activation energy and the temperature range.
A small increase in temperature produces a much larger increase in the number of particles with energy above .
A fixed-endpoint investigation uses sodium thiosulfate and hydrochloric acid: sulfur forms and eventually hides a cross beneath the flask. Bring both solutions to the target temperature in a water bath before mixing, start a stopwatch immediately, and record the time until the same cross is just hidden. Keep concentrations, total volume, viewing direction and flask constant. Repeat at each temperature and plot 1/t against measured temperature. Use small quantities, goggles and suitable ventilation because sulfur dioxide forms; do not seal the flask. Required practical 3 develops the complete procedure and its limitations.