3.1.9.2 - Determination of Rate Equation
A rate equation is not taken from the balanced equation. It is worked out from experimental data, because the coefficients in the chemical equation tell you the stoichiometry, not which particles control the speed of the reaction. In this lesson, you will turn concentration-time information into rates, use initial-rate data to find orders, build a full rate equation, and then use that equation to say something sensible about the rate-determining step.
From concentration-time data to rate
The first job is to extract a rate from experimental data. On a concentration-time graph, the gradient tells you how quickly concentration is changing.
For a reactant, the graph usually slopes downwards because the reactant is being used up, so the gradient is negative. For a product, the graph slopes upwards, so the gradient is positive. By convention, the rate is usually quoted as a positive value, so for a reactant you usually give the magnitude of the gradient.
Initial rate
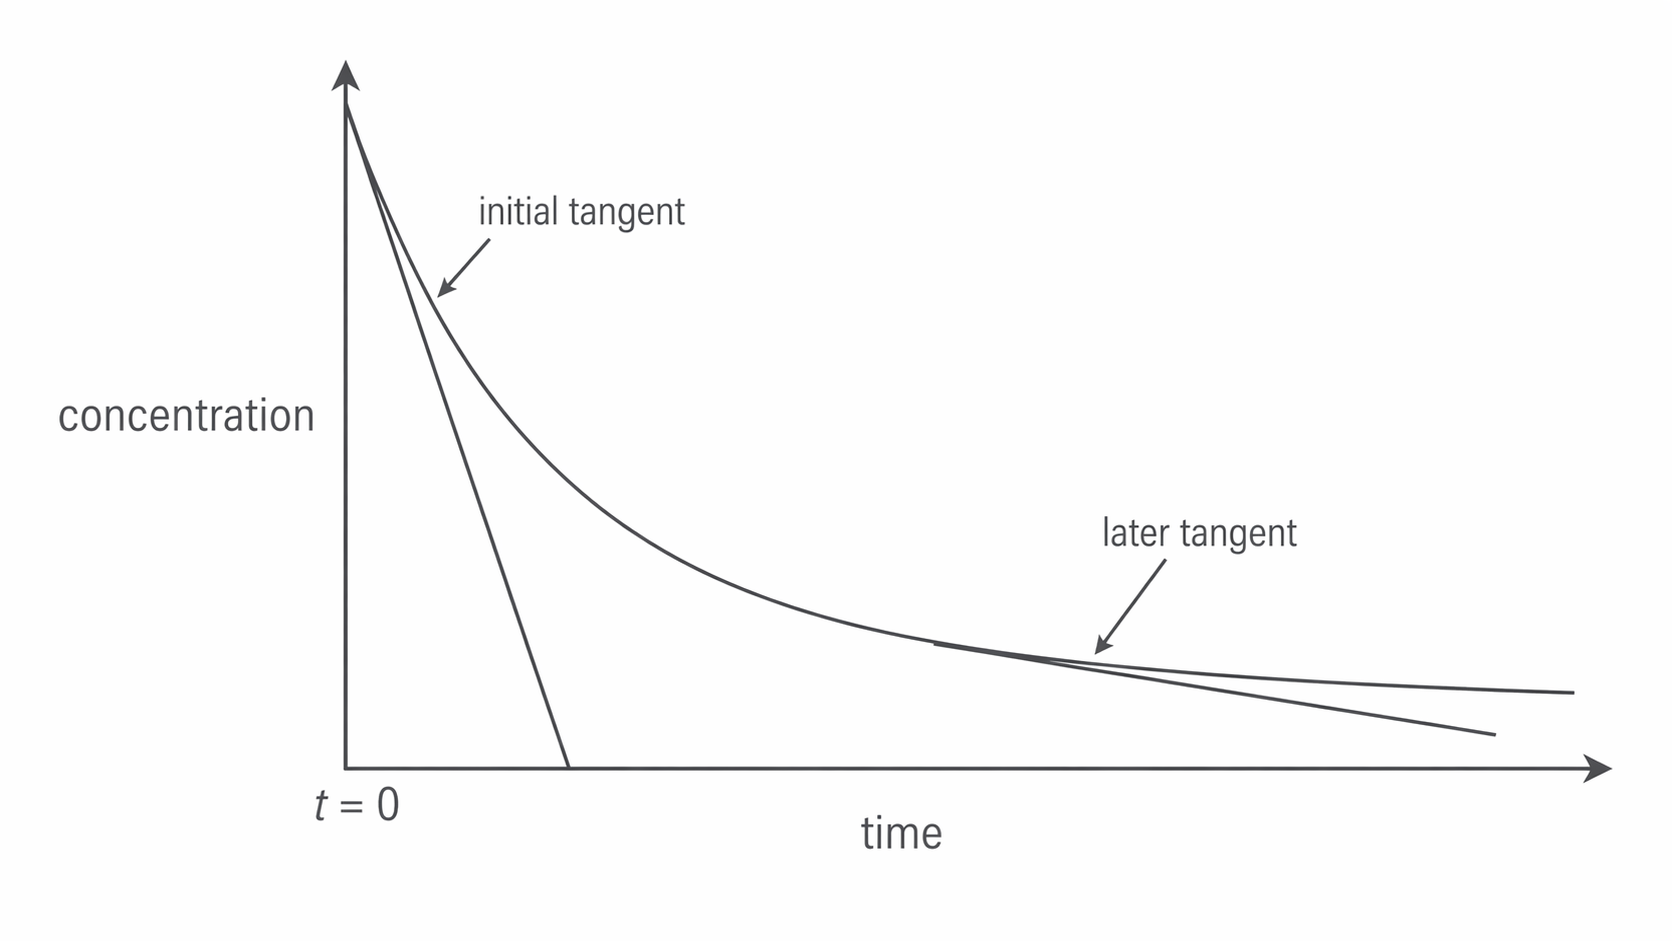
The initial rate is the rate measured at the start of a reaction, when . It is found from the gradient of a tangent drawn to the concentration-time curve at .
If you want the rate at one exact moment, you need a tangent. If you only join two plotted points, you are finding an average rate over that interval instead. That distinction matters, because the rate usually falls as reactants are used up.
The diagram below shows why the tangent at the start of the run is steeper than a tangent drawn later in the same reaction.
[DIAGRAM: asset_name: 1.9.2 - Determination of Rate Equation - Diagram 1; asset_slug: 1.9.2 - Determination of Rate Equation - Diagram 1; recommended_method: retained_png; description: Concentration-time graph for a reactant, with concentration on the y-axis and time on the x-axis. Draw a downward curve that is steep at the start and then levels off. Add a tangent at t = 0 labelled initial tangent with a steep negative gradient, and a later tangent labelled later tangent with a shallower negative gradient.]
Worked example: a tangent to a reactant concentration-time curve passes through and .
So the initial rate of disappearance of the reactant is:
If the data are given as a concentration-time table rather than a graph, first plot or sketch the graph and then draw the tangent at .
Sometimes chemists measure initial rate indirectly. In an iodine clock reaction, the same fixed amount of iodine has to be produced before the blue-black starch-iodine colour appears. Use a small fixed amount of thiosulfate to set a small iodine threshold, so reactant concentrations change negligibly before the colour appears. Because the same small amount is produced in every run, a shorter time means a faster initial rate, so is approximately proportional to initial rate.
When plotting measured data, label both axes with quantities and units and draw a smooth best-fit curve through the overall pattern rather than joining every point with ruler segments. Draw a tangent that matches the local direction of the curve, then choose two widely separated points on that tangent, which need not be data points. For a straight falling zero-order concentration–time graph, every tangent has the same gradient and . For example, a fall of in gives .
Using initial rates to find order
Once you can measure an initial rate, you can find how the rate depends on concentration. This is why chemists repeat the reaction several times with different starting concentrations.
To find the order with respect to one reactant, change only that reactant's concentration and keep everything else the same, especially temperature and the concentrations of the other reactants. If two concentrations change at once, that comparison alone does not isolate either effect. Once one order is known from another comparison, its contribution can be divided out to find the other order.
Order with respect to a reactant
The order with respect to a reactant is the power to which that reactant's concentration is raised in the rate equation. It is found experimentally from how the rate changes when the concentration changes.
In this topic, the possibilities are usually zero, first, or second order:
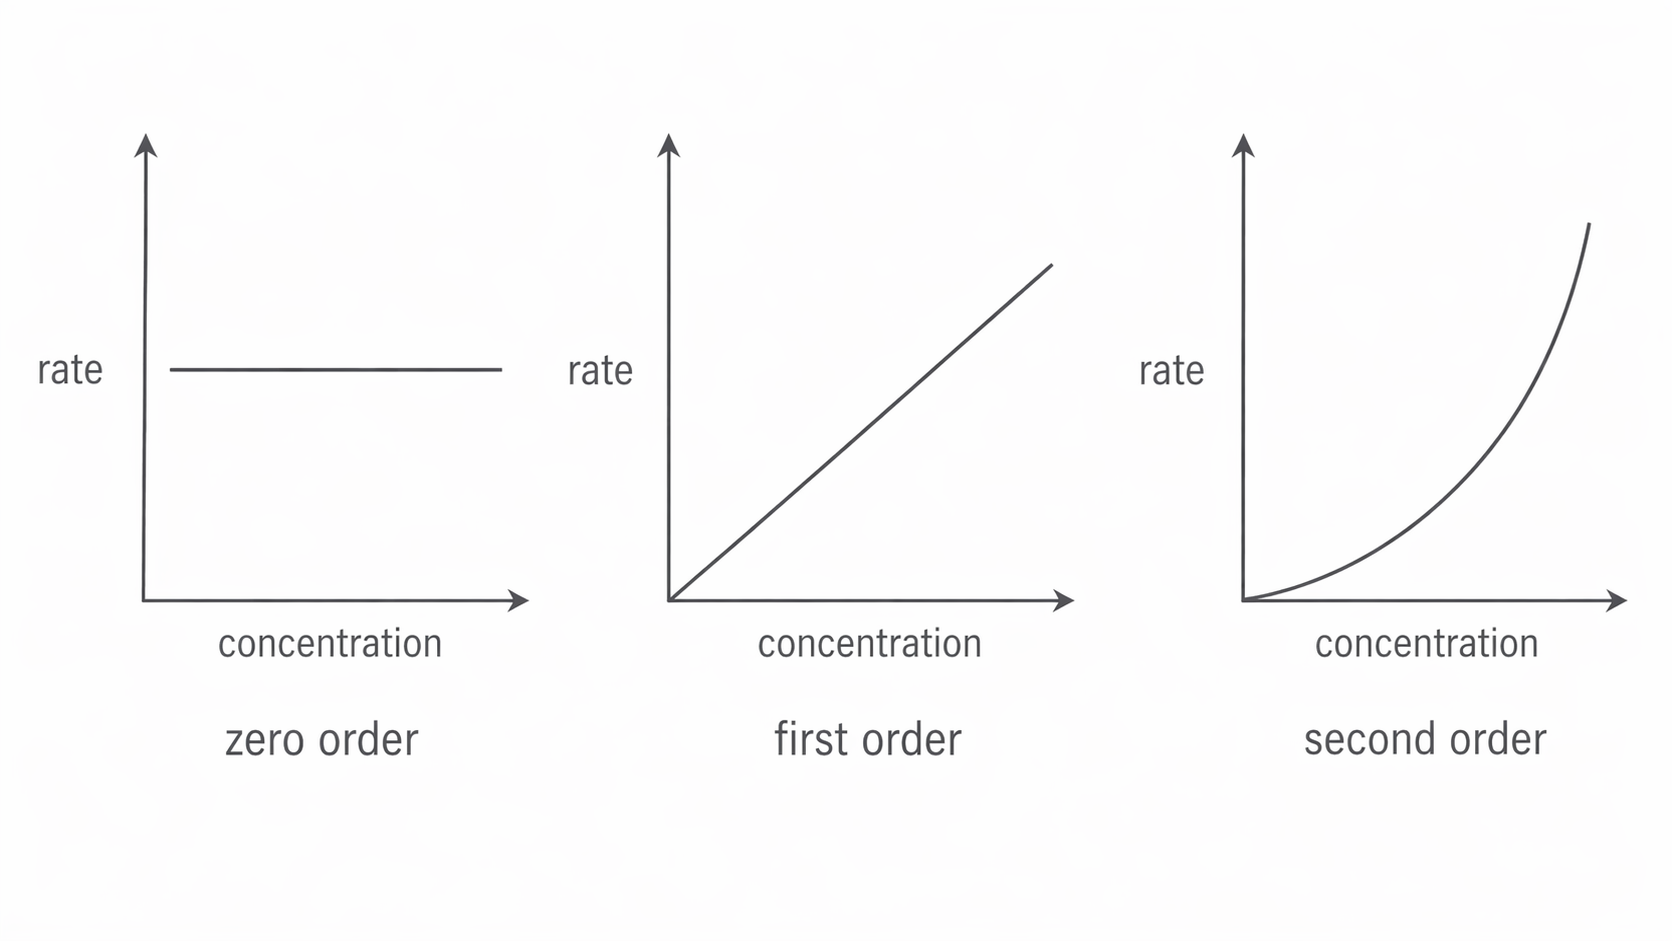
- Zero order: changing the concentration does not change the rate.
- First order: doubling the concentration doubles the rate.
- Second order: doubling the concentration makes the rate four times larger.
The quick way to think about this is:
So if concentration changes by a factor of 2 and the rate changes by a factor of 4, the order must be 2.
The diagram below compares the three rate-concentration patterns you are expected to recognise quickly.
[DIAGRAM: asset_name: 1.9.2 - Determination of Rate Equation - Diagram 2; asset_slug: 1.9.2 - Determination of Rate Equation - Diagram 2; recommended_method: retained_png; description: Three side-by-side graphs on matching scales, each with rate on the y-axis and concentration on the x-axis. Left graph is a horizontal line labelled zero order. Middle graph is a straight line through the origin labelled first order. Right graph is an upward-curving line from the origin labelled second order.]
The iodine clock data are a good example. If is halved from to , the time doubles from 20 s to 40 s, so halves from to . Halving concentration halves the initial rate, so the reaction is first order with respect to .
Continue this lesson.
You’re previewing NovaLearn without an account. Create a free account to read the rest.
Create free account