Required practical 7 - Initial Rates and Continuous Monitoring
This required practical is about choosing a method that makes rate visible. In one method, you time how long it takes for a fixed event to happen, such as the sudden blue-black colour in the iodine clock. In the other, you collect data continuously as the reaction proceeds, such as gas volume against time. The important thing is not just knowing the steps, but seeing why the method works, how initial rate is obtained, and how order and uncertainty are judged from the data.
Choosing a Rate Method
Rate of reaction tells you how quickly reactants are being used up or products are being formed. In practice, chemists do not always measure concentration directly. Instead, they choose something that changes in a measurable way during the reaction, such as colour, gas volume, mass, or pH.
Initial rate
The rate of reaction right at the start of the reaction, when the reactant concentrations are known most accurately.
Initial rate methods are useful when you want fair comparisons between experiments. Because the rate is taken at the start, you are comparing reactions before much of either reactant has been used up. That matters when you want to work out how changing concentration affects rate.
A continuous monitoring method is different: instead of waiting for one endpoint, you record measurements throughout the reaction. This gives a fuller picture of how the rate changes with time, but you then need a graph and a tangent if you want the initial rate.
For this required practical, the two headline examples are:
- an iodine clock reaction as an initial rate method
- magnesium reacting with hydrochloric acid as a continuous monitoring method
The common idea is the same in both cases: measure something that changes because the chemistry is happening, then process the data in a way that gives a fair rate comparison.
The Iodine Clock as an Initial Rate Method
In the iodine clock experiment, hydrogen peroxide oxidises iodide ions to iodine in acidic solution:
At the same time, thiosulfate ions remove the iodine as soon as it forms:
This second reaction is what makes the clock idea work. At first, no blue-black colour appears because the iodine is being used up by thiosulfate ions. Once all the thiosulfate has been used, iodine can remain in the mixture. That free iodine then forms a blue-black complex with starch, so the colour change marks a clear endpoint.
The diagram below shows the two stages of the iodine clock method, from starting the timer on mixing to the sudden starch endpoint.
[DIAGRAM: asset_name: RP 07 - Measuring the Rate of Reaction - Diagram 1; asset_slug: RP 07 - Measuring the Rate of Reaction - Diagram 1; recommended_method: retained_png; description: Two bordered panels with conical flasks showing the iodine clock sequence. Left panel: clear reaction mixture just after mixing hydrogen peroxide into acidified iodide solution containing starch and a fixed amount of thiosulfate; labels "start timer", "I2 formed", "S2O3^2- removes I2", and "no blue-black colour yet", with mixing arrows inside the flask. Right panel: later stage after all thiosulfate has been used; the flask contents are dark blue-black and labelled "I2 remains", "I2 + starch complex", and "sudden blue-black endpoint / stop timer". Bottom callouts state "same fixed amount of thiosulfate in every run" and "same fixed amount of iodine at endpoint".]
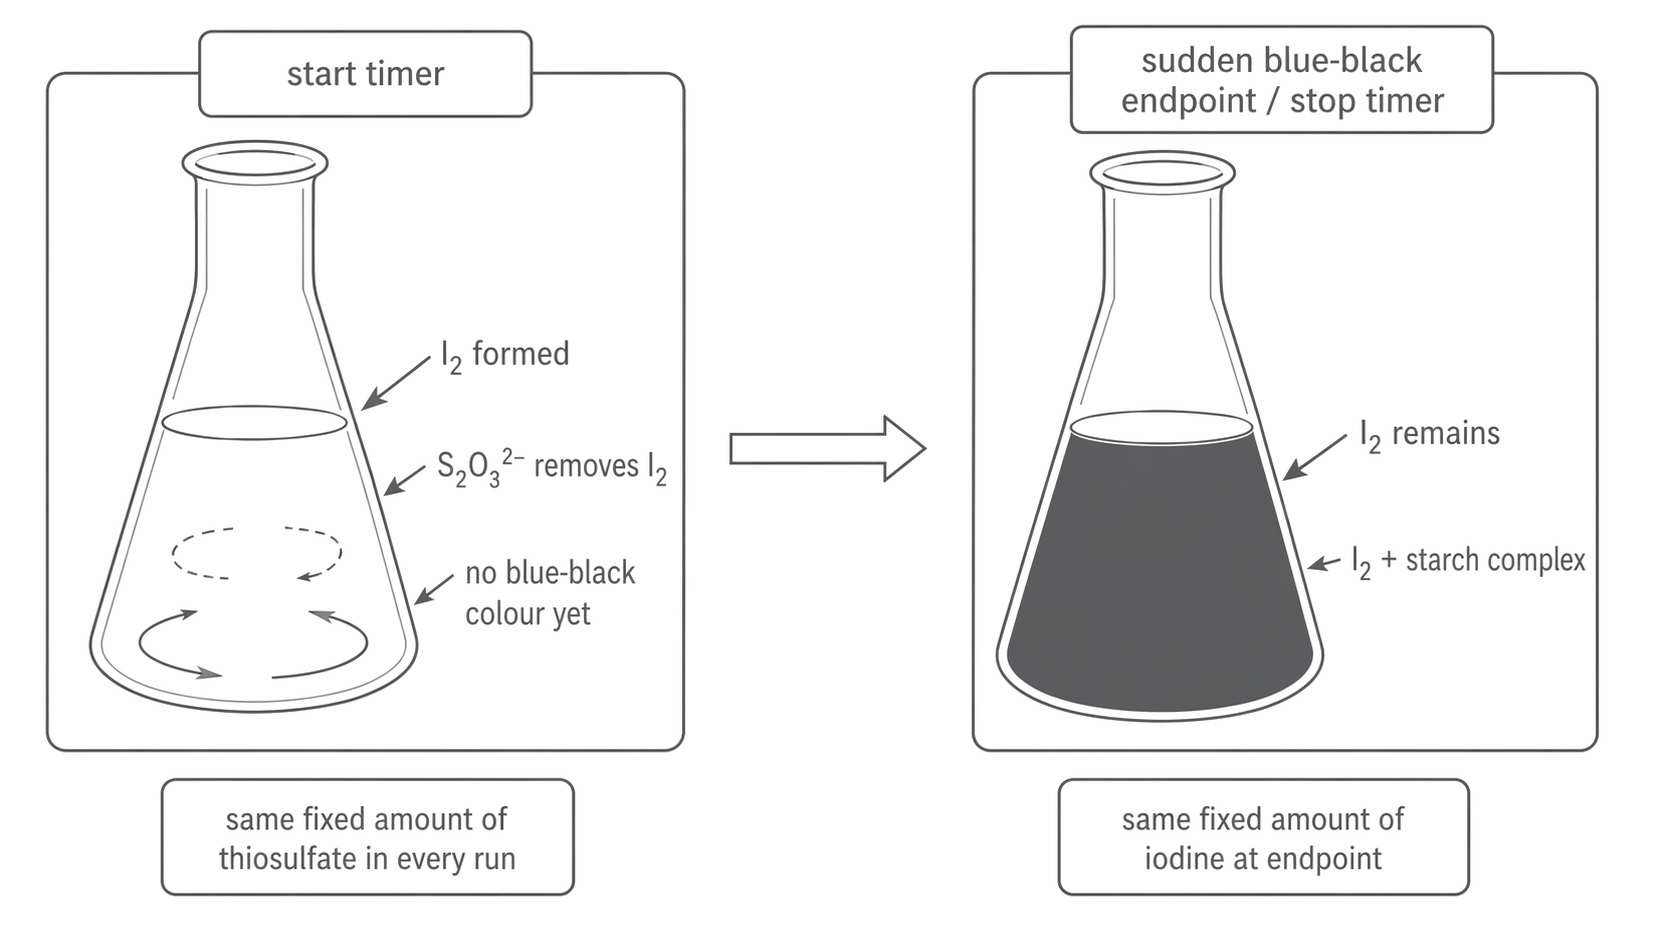
The important hidden feature is that each run contains the same amount of thiosulfate. That means the blue-black colour appears only after the same fixed amount of iodine has been produced each time. When this fixed amount is small enough for the endpoint to occur early, a shorter time indicates a greater approximate initial rate.
In a school lab, you usually keep the hydrogen peroxide concentration, acid concentration, starch, thiosulfate volume, total volume, and temperature the same, while changing only the concentration of potassium iodide solution. That way, any rate change can be linked to iodide concentration rather than to some other variable.
The method also depends on disciplined technique. Start timing immediately after mixing, stir consistently, and use accurate apparatus for measured volumes. A delay of even a second matters more when the reaction is fast.
Prepare a results table before starting: run number, stock concentrations, volumes of every solution and water, total volume, initial concentration after mixing, temperature, repeat times and mean time. Vary one reactant volume and replace the difference with water so total volume is constant. For example, of iodide in a mixture gives an initial iodide concentration of , not the stock value. Keep the other reactants and small thiosulfate amount fixed. Equilibrate solutions in a water bath, check temperature, add the initiating reagent last, mix consistently and start timing immediately. Repeat each condition and investigate anomalous times rather than silently deleting them.
Using Iodine Clock Data to Determine Order
To determine the order with respect to iodide ions, you repeat the iodine clock experiment with different iodide concentrations while keeping the other conditions constant. Keep the same small amount of thiosulfate in every run, so the endpoint is reached early, before reactant concentrations change appreciably. Under this approximation, is proportional to the initial rate; a large endpoint amount would instead reflect an average over a changing rate.
Order of reaction
The power to which a reactant concentration is raised in the rate equation, showing how strongly the rate depends on that reactant's concentration.
This practical often uses a graph of relative initial rate against concentration. The pattern of the graph tells you the order:
- if doubling the concentration doubles the rate, the reaction is first order with respect to that reactant
- if doubling the concentration makes little or no difference, it is zero order
- if doubling the concentration makes the rate four times larger, it is second order
Worked example: if the iodide concentration is doubled from to and the time to the blue-black colour falls from to , then the relative initial rate changes from to . The rate has doubled when the concentration doubled, so the reaction is first order with respect to iodide ions.
One subtle point is that, in multi-reactant systems, a reactant kept in large excess changes so little during the run that its concentration is effectively constant. In practical terms, that reactant then does not complicate the rate comparison you are making.
The diagram below shows the straight-line pattern you expect when is directly proportional to iodide concentration, alongside the contrasting zero- and second-order shapes.
Continue this lesson.
You’re previewing NovaLearn without an account. Create a free account to read the rest.
Create free account