3.1.12.5 - pH Curves, Titrations and Indicators
Acid-base titrations give you two kinds of information at once. The titre lets you calculate an unknown concentration, and the pH curve shows how the chemistry changes as neutralisation is approached and then passed. In this lesson, you will learn how to read and sketch the four standard pH curves for monoprotic acids and bases, how to choose a suitable indicator, and how to turn titration results into concentration calculations.
What A Titration Curve Shows
A titration is a method for finding the concentration of one solution by reacting it with another solution of known concentration. In an acid-base titration, one solution is delivered from a burette into a measured volume of the other solution, usually placed in a conical flask with a pipette. If you record the pH after each addition, you can plot a pH curve.
Here the standard curves use monoprotic acids, so each acid molecule donates one proton, , per molecule. That keeps the stoichiometry of the pH curves simple: one acid molecule can supply one proton, even though the acid may be strong or weak.
Equivalence point
The equivalence point is the point in a titration at which the acid and base have reacted in exactly the stoichiometric ratio shown by the balanced equation.
The equivalence point is not quite the same as the end point. The end point is the point where the indicator changes colour. In a good titration, the end point should be as close as possible to the equivalence point, otherwise the calculated concentration will be inaccurate.
When a pH curve is measured, the pH is plotted on the y-axis and the volume added from the burette on the x-axis. The additions should be small, and they should become even smaller near the equivalence point because that is where the pH can change very rapidly. Away from the equivalence point, a whole cubic centimetre may change the pH only slightly. Near the steep section, even a drop can matter.
If the base is added to the acid, the curve rises from low pH to high pH. If the acid is added to the base, the curve falls instead, but the same ideas still apply: the equivalence point is where the reacting amounts match, and the useful indicator is still the one whose colour change happens in the steep part of the curve.
Reading And Sketching The Four Curves
To compare the four standard curves clearly, it helps to imagine the same experimental pattern each time: a base is added from the burette to an acid in the flask. In a sketch, always label the axes clearly as pH and volume of base added / .
The diagram below compares the four standard titration-curve shapes when base is added to acid.
[DIAGRAM: asset_name: 1.12.5 - pH Curves, Titrations and Indicators - Diagram 1; asset_slug: 1.12.5 - pH Curves, Titrations and Indicators - Diagram 1; recommended_method: matplotlib_exact_plot; description: Four exact charge-balance pH plots at25C using25mL0.1M acid and0.1M base, weak Ka=Kb1.74e-5; equivalence dots and volume guides. Weak-base excess tail alkaline; equal-KaKb special weak/weak neutrality.]
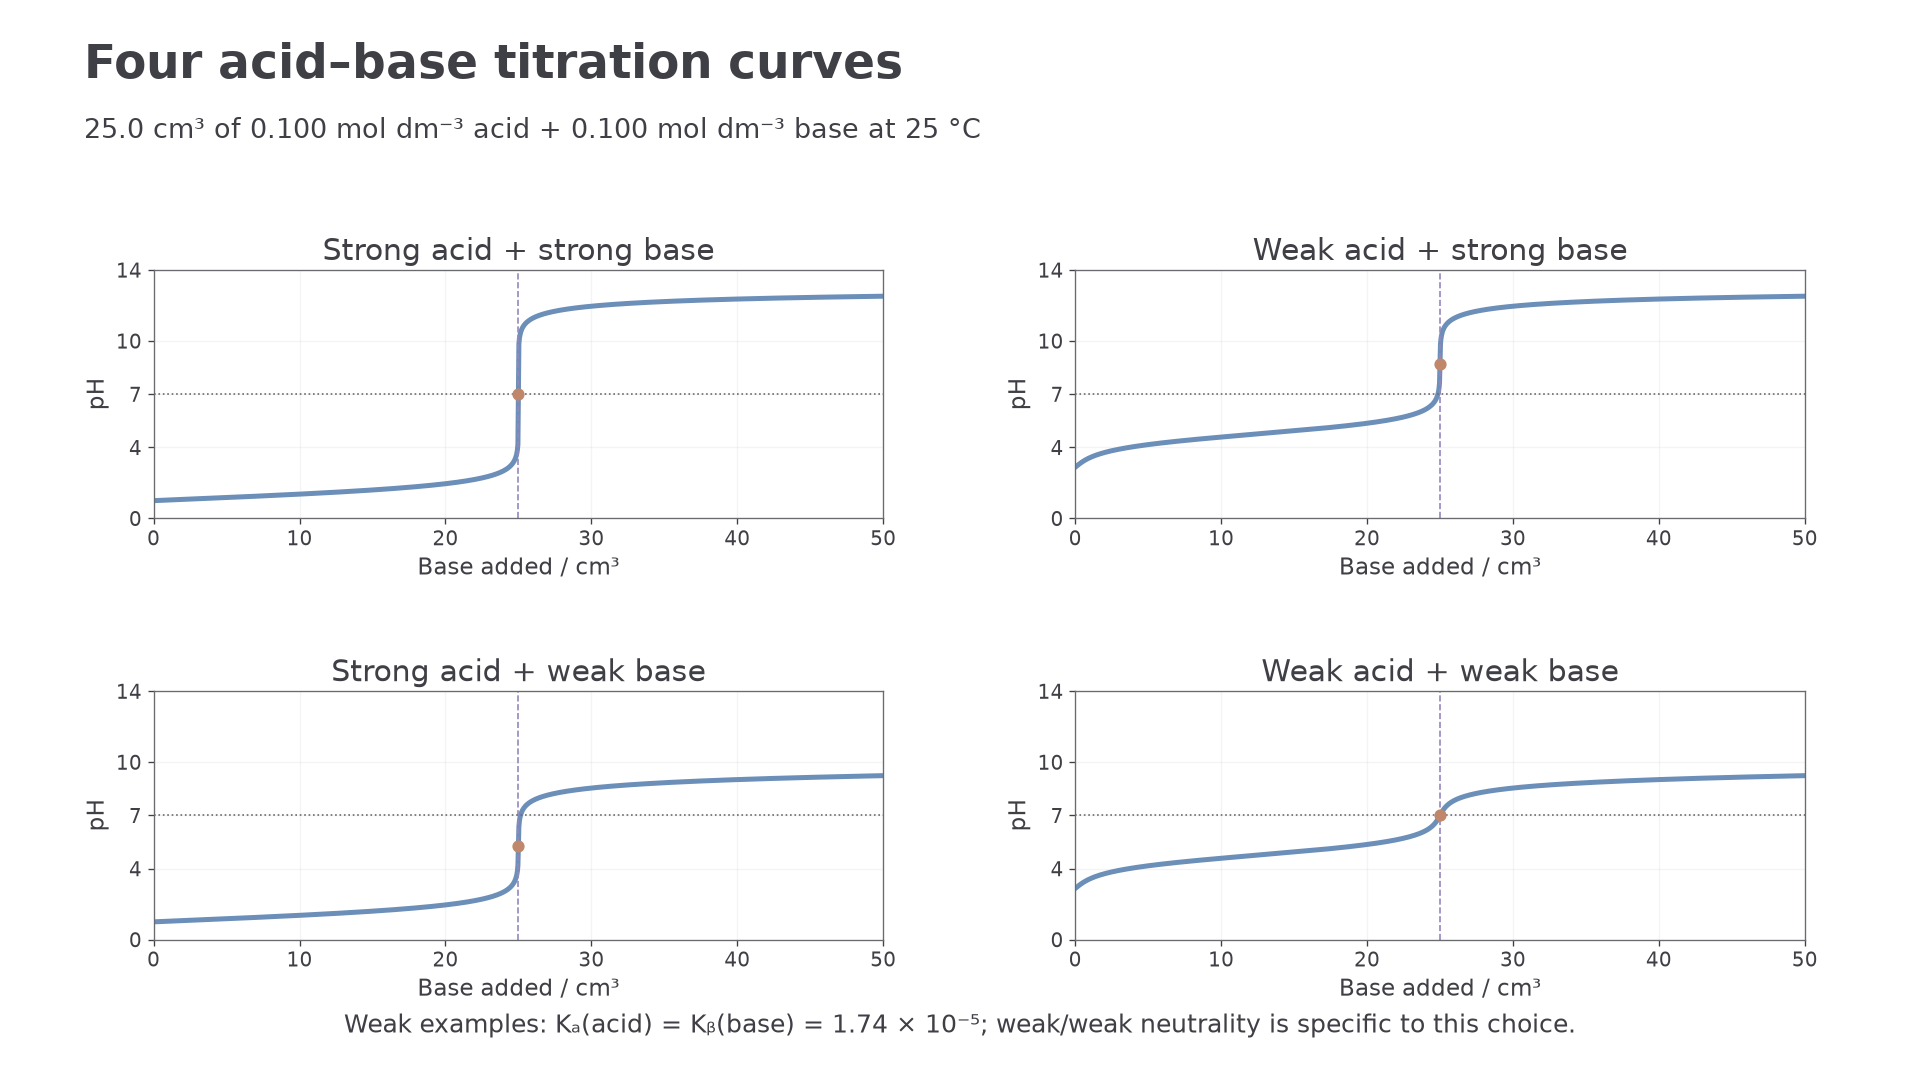
For a strong acid-strong base titration, the curve starts at very low pH because the acid is fully dissociated. The pH then rises slowly at first, jumps very steeply at the equivalence point, and finishes at high pH once excess base has been added. The equivalence point is close to pH 7 because the salt formed does not significantly hydrolyse the water.
For a weak acid-strong base titration, the curve starts at a higher pH because the acid is only partially dissociated. Before the equivalence point there is a gentler region because the weak acid and its conjugate base resist large pH changes. The equivalence point is above pH 7 because the salt formed contains the conjugate base of the weak acid, and that conjugate base reacts with water to produce some .
For a strong acid-weak base titration, the starting pH is low because the acid is strong, but the rise near the equivalence point is less dramatic than for a strong base. The equivalence point is below pH 7 because the salt formed contains the conjugate acid of the weak base, which can donate to the solution.
For a weak acid-weak base titration, the curve has no large vertical section at all. The pH changes gradually through the equivalence region, so the end point is hard to locate accurately with an indicator. The equivalence pH depends on the relative strengths of the weak acid and weak base; it is not always 7. Equal acid and base dissociation constants give a neutral equivalence solution at 25 °C. The key point is that the curve is too shallow for a sharp indicator change.
A clear description of a curve includes the starting pH, the steepness of the change around the equivalence point, and whether the equivalence point is below 7, near 7, or above 7.
The neutral-equivalence value of pH 7 refers to . With strong acid and weak base, the equivalence solution is acidic, but adding excess ammonia eventually makes the solution alkaline: the right-hand tail must rise above pH 7. Weak-acid/weak-base equivalence is not automatically neutral; its pH depends on the relative acid and base strengths. Sketch labelled axes, the correct initial pH, an equivalence region at the calculated volume, and the appropriate excess-reagent tail. Do not draw every curve with the same vertical jump.
Continue this lesson.
You’re previewing NovaLearn without an account. Create a free account to read the rest.
Create free account