3.1.5.2 - Maxwell-Boltzmann Distribution
In a gas, particles do not all move with the same speed, so they do not all have the same kinetic energy. A Maxwell-Boltzmann distribution shows how those energies are spread across a sample. In this lesson, you will learn how to sketch the curve correctly and how changing temperature changes what the curve tells you about particles with enough energy to react.
Reading the distribution
The key idea is that a gas contains a spread of energies, not one single energy shared by every particle.
Maxwell-Boltzmann distribution
A graph showing how the energies of particles are distributed in a sample of gas at a particular temperature.
On a Maxwell-Boltzmann graph, the x-axis is energy and the y-axis is the number of molecules, or the fraction of molecules, with that energy. The curve starts at the origin because no particles have exactly zero energy. It then rises to a peak and falls away in a long tail to the right.
The diagram below shows the standard shape of a Maxwell-Boltzmann distribution for a fixed sample of gas at one temperature.
[DIAGRAM: asset_name: 1.5.2 - Maxwell-Boltzmann Distribution - Diagram 1; asset_slug: 1.5.2 - Maxwell-Boltzmann Distribution - Diagram 1; recommended_method: retained_png; description: A Maxwell–Boltzmann distribution starts at the origin, has one most-probable energy and approaches the energy axis in a long tail.]
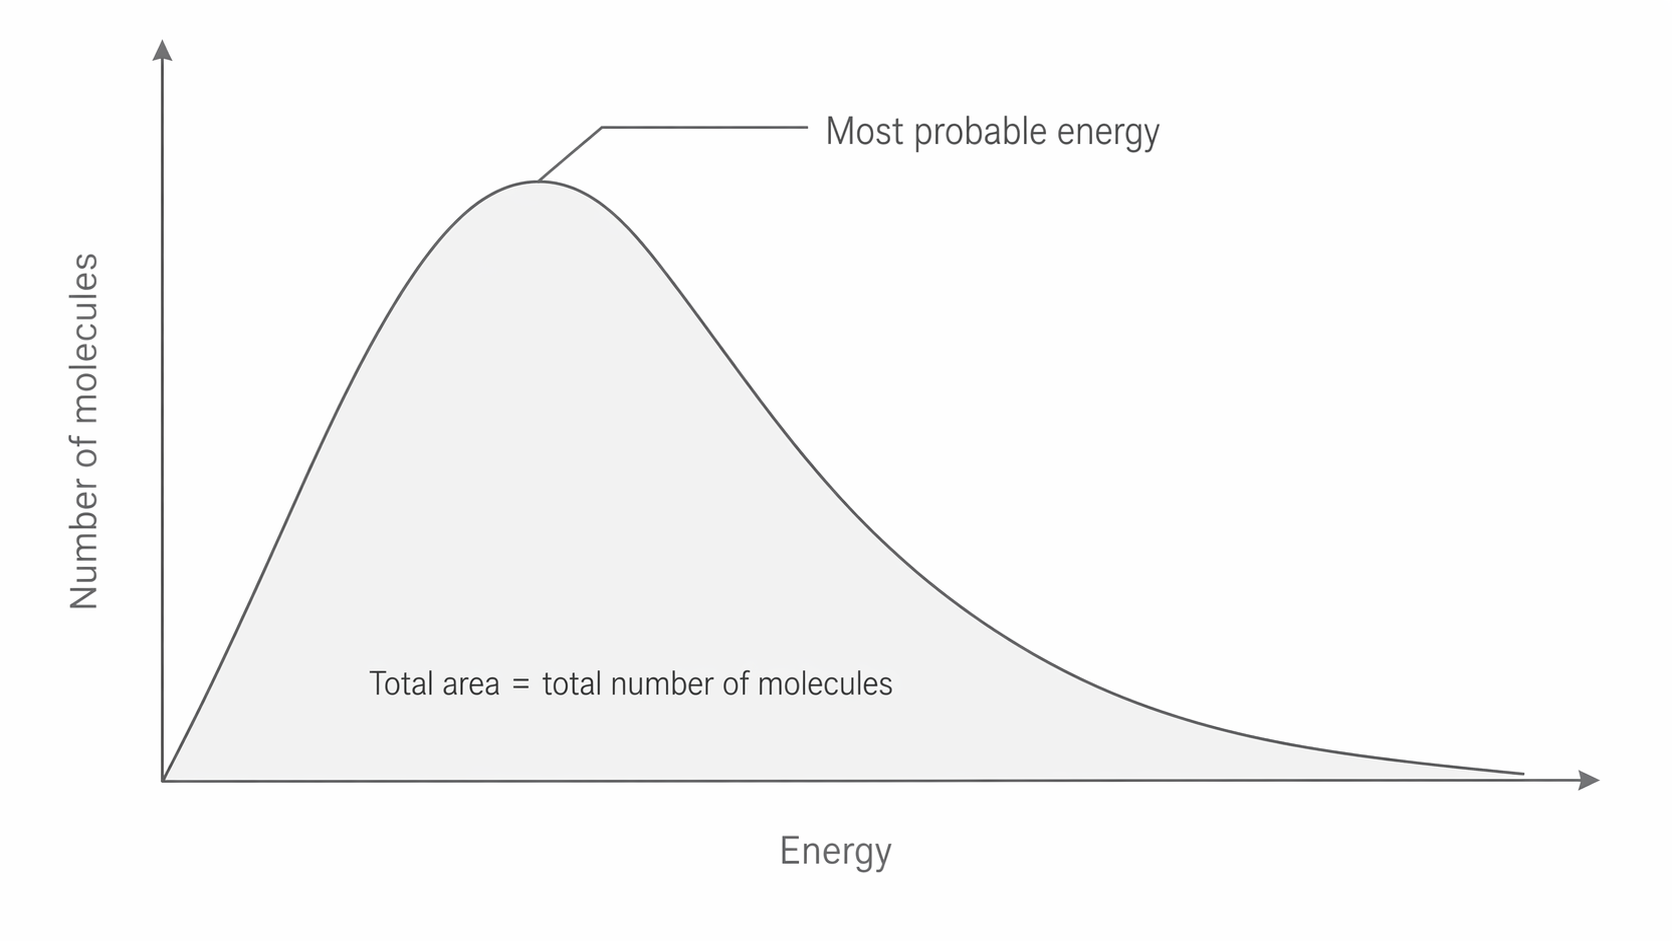
A plotted interval represents molecules within a small energy range; the smooth curve is an idealised distribution. The usual exam y-axis label “number of molecules” is shorthand for the number in equal energy intervals.
The peak marks the most probable energy, which is the energy value possessed by the largest number of molecules. That is not the same thing as the average energy: the long high-energy tail makes the mean greater than the most probable energy. Most molecules have intermediate energies, very few have very low energies, and very few have very high energies.
Another essential feature is the area under the curve. For a fixed amount of gas, this area stays constant because it represents the total number of molecules in the sample. If the shape changes, the molecules are being redistributed across energy values, not added or removed.
Temperature and activation energy
To interpret the curve in reactions, we often compare it with the activation energy for a particular reaction.
Activation energy
The minimum energy that colliding particles must have for a reaction to occur.
If you draw a vertical line for the activation energy, the area under the curve to the right of that line represents the particles with enough energy to react. These are the particles that can make successful collisions.
When the temperature increases, the distribution changes shape. The peak becomes lower, the curve becomes broader, and the peak moves to the right. The total area under the curve stays the same, because the number of molecules has not changed.
The diagram below compares the same reaction at two temperatures and keeps the activation energy line fixed so the larger area beyond is easy to see.
[DIAGRAM: asset_name: 1.5.2 - Maxwell-Boltzmann Distribution - Diagram 2; asset_slug: 1.5.2 - Maxwell-Boltzmann Distribution - Diagram 2; recommended_method: deterministic_code; description: Normalised Maxwell–Boltzmann distributions with equal total area; higher temperature increases the fraction above the same activation energy.]
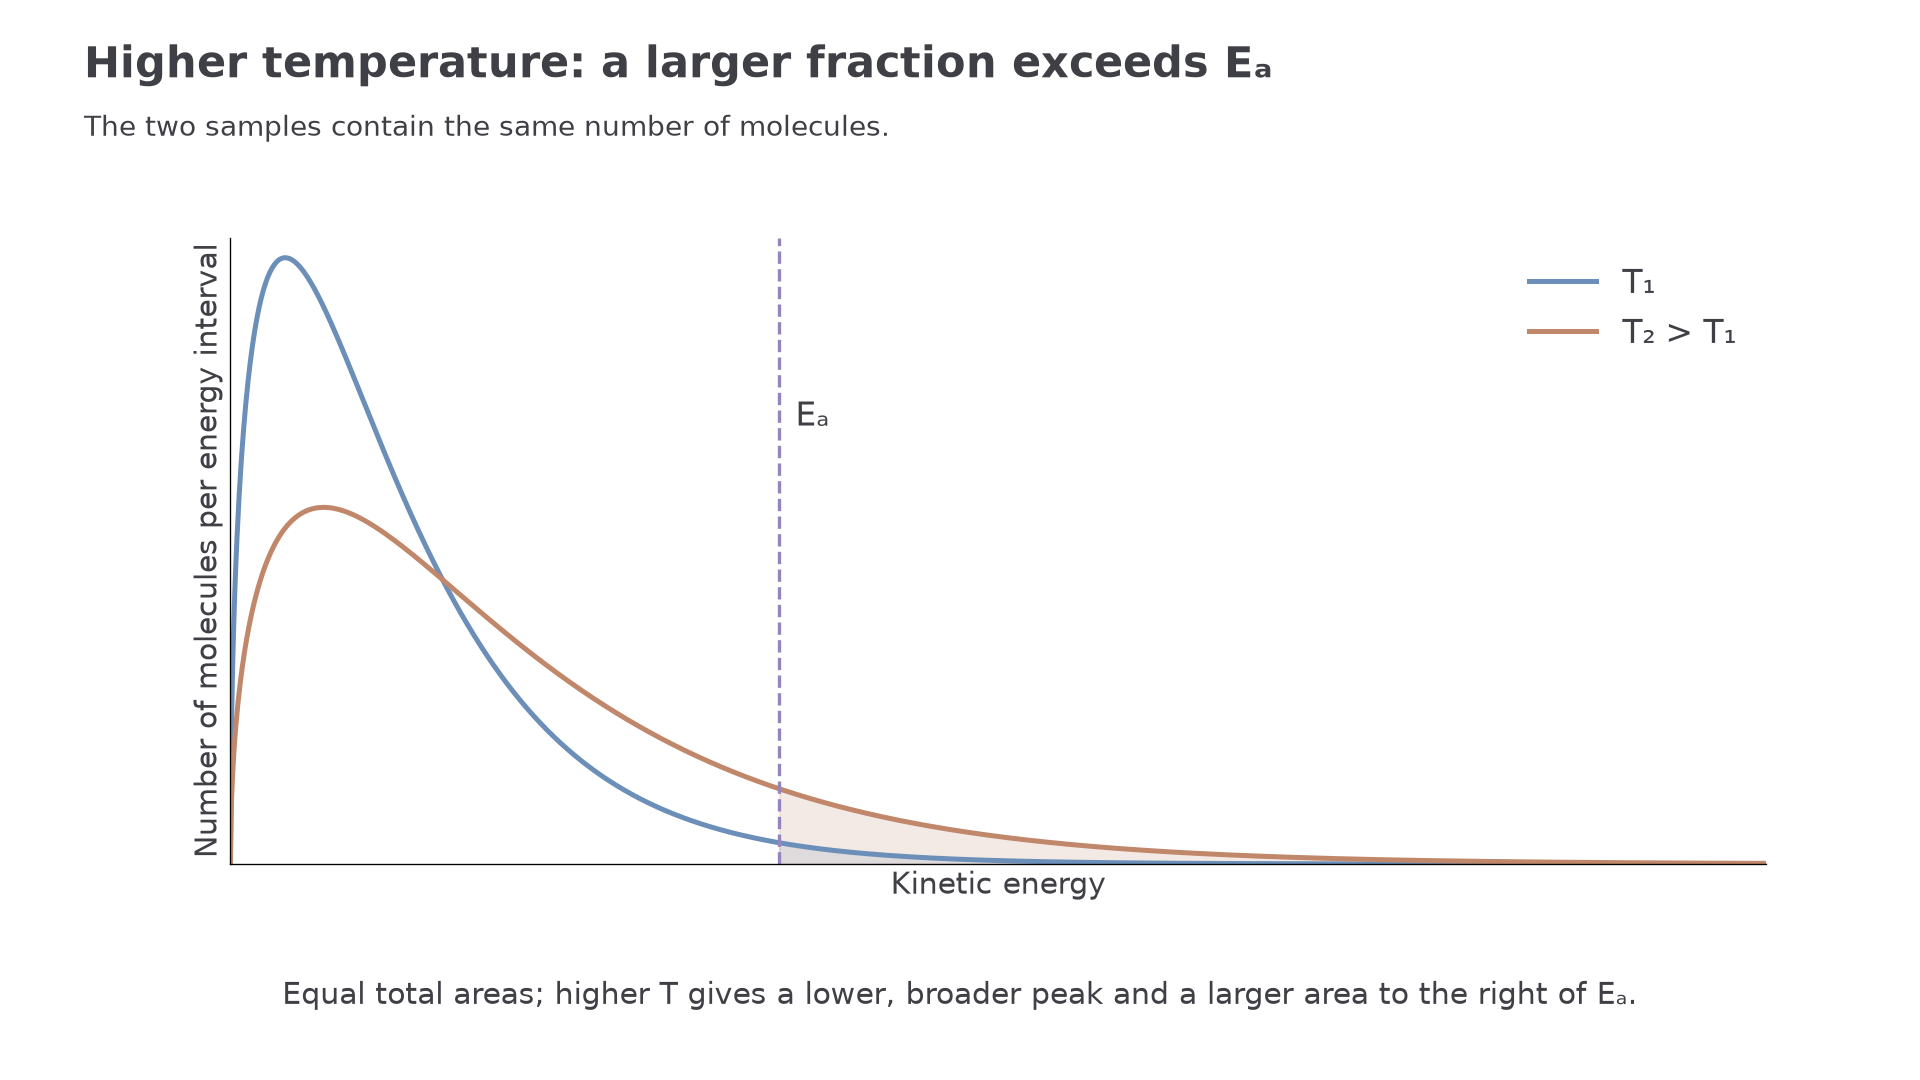
This matters because the area to the right of the activation energy line increases noticeably at higher temperature. Even a small rise in temperature can produce a much larger number of molecules with energy equal to or greater than the activation energy. That is why reaction rate increases strongly with temperature: a bigger fraction of collisions now has enough energy to react.
The activation energy itself does not change just because the temperature changes. If you are comparing the same reaction at two temperatures, the line should stay in the same place. What changes is the shape of the distribution and therefore the proportion of particles beyond that line.
Area, fraction and number of molecules
Use areas rather than the height of the curve at one energy to count molecules. If the total area represents molecules and 0.50% of the area lies beyond , the number with sufficient energy is . A higher curve at one point alone does not tell you the total number above the threshold.
The axis label determines what stays constant. With number of molecules on the vertical axis, doubling the amount of gas at the same temperature doubles the curve's height and total area, while the most probable energy stays fixed. With fraction of molecules on the vertical axis, the normalised curve is unchanged: the same fraction has each energy. Neither adding gas nor compressing a fixed sample at constant temperature shifts the energy distribution to the right.
For a fixed sample heated to a higher temperature, draw a lower, broader peak further right, with unchanged total area. Both curves begin at the origin and approach the energy axis without reaching it at a finite energy. Keep the reaction's fixed. An energy-axis tail cut off abruptly, a larger area for the same sample, or a moved line would each claim a different physical change.