Statistics 4.1 - Discrete and binomial probability distributions
Use a probability distribution to describe a whole set of possible outcomes. Build Binomial models, calculate individual and cumulative probabilities, and decide whether the assumptions fit the situation.
What a discrete distribution tells you
If a spinner has four possible scores, must each score have probability ? A spinner with four equal sectors labelled , , and does. Change the sector sizes, and the same four scores can have quite different probabilities. The list of possible values is only half the story.
You already know
Probabilities lie between and . Mutually exclusive outcomes covering every possibility have probabilities adding to .
A capital letter names the random variable; a lower-case letter names a possible value. For example, is the score on a fair six-sided die, while is one possible score.
Discrete probability distribution
A discrete random variable takes separate countable values. Its probability distribution lists every possible value and its probability , with
A discrete uniform distribution has equal probabilities for all its possible values.
The fair die has six probabilities of . A distribution need not be uniform: the Binomial bars on the right have different heights because some counts can occur in more ways than others.
[DIAGRAM: asset_slug: p3_4_1_understand_and_use_simple_discrete_probability_distributions__diagram_01; asset_name: Statistics 4.1 - Discrete and binomial probability distributions - diagram 01; description: Equal-height probabilities for a fair six-sided die beside the unequal probabilities of a Binomial B(6, 0.4) count.]
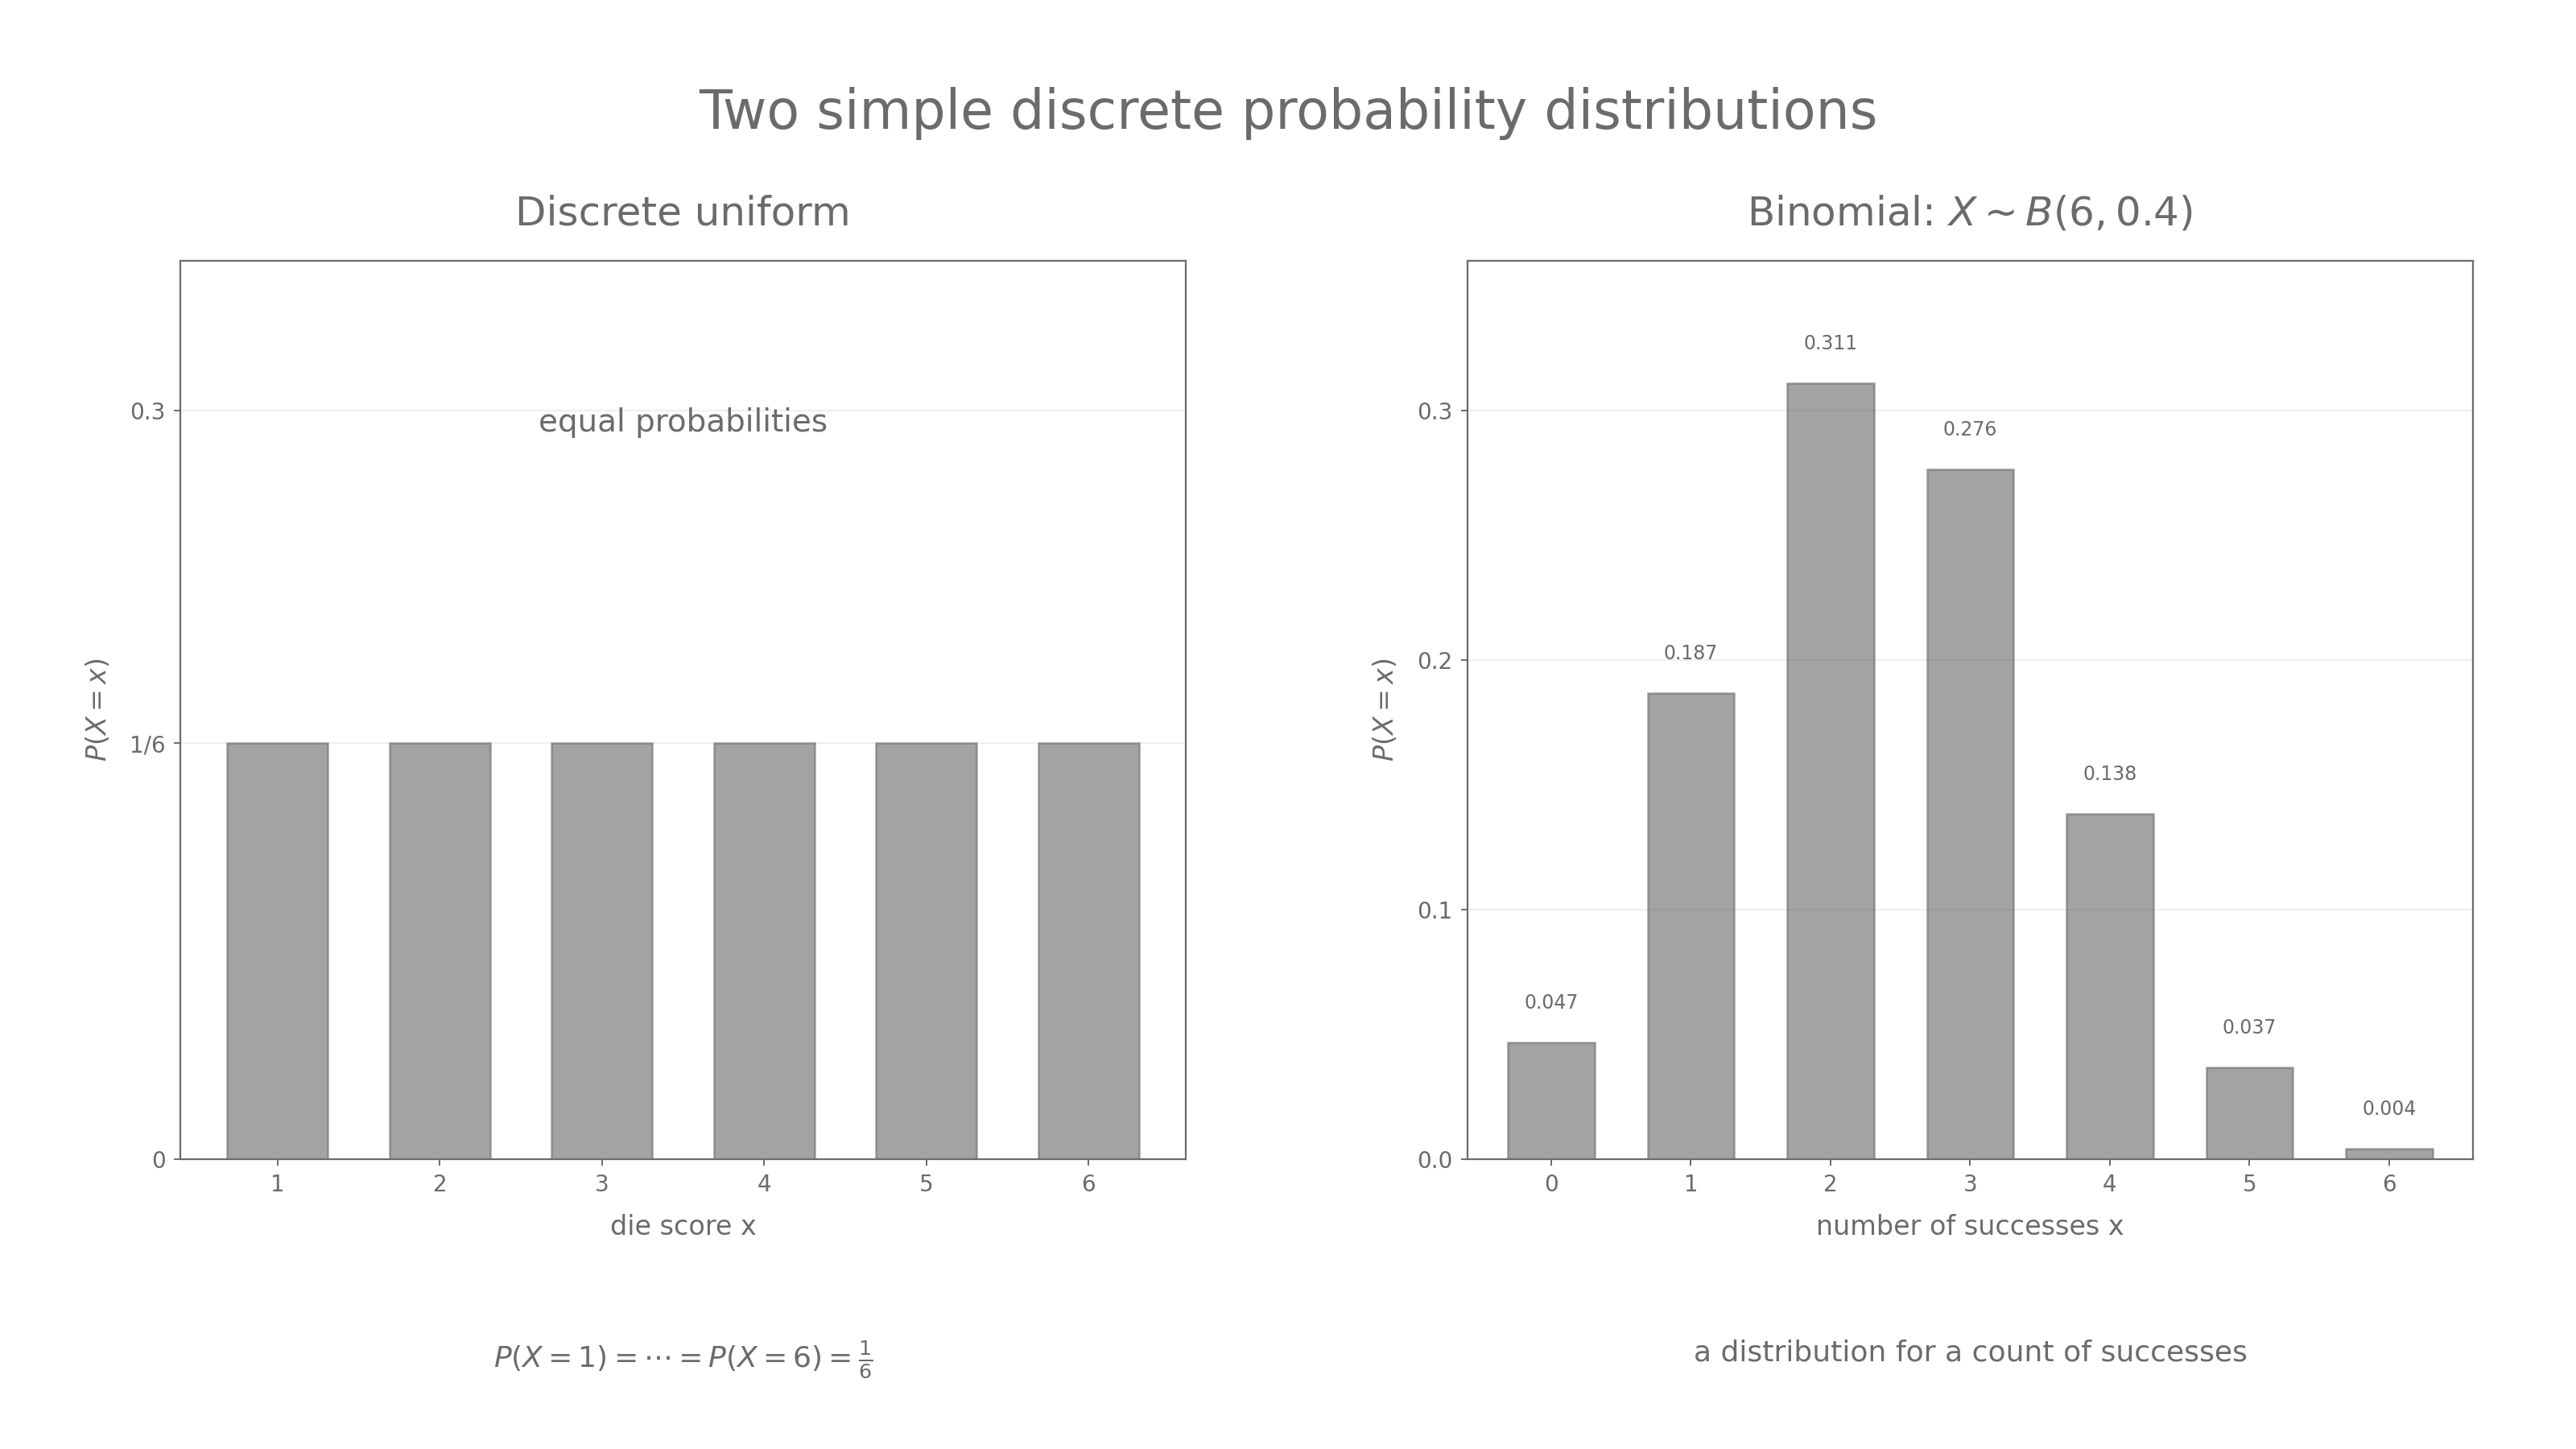
To find an event's probability, add the probabilities of the values it includes. First see this with equal sectors.
Worked example 1: equal spinner sectors
Question. A fair spinner has four equal sectors labelled , , and . Let be its score. State its distribution and find .
Plan. Give each equally likely score the same probability, then add the included scores.
Why add? The spinner cannot land on both scores in one spin, so the outcomes are mutually exclusive.
Answer. has a discrete uniform distribution on , and .
Check. The full distribution sums to ; the event uses two of the four equal sectors.
Now change only the sector sizes. The labels stay the same, but equal probabilities can no longer be assumed.
Worked example 2: unequal spinner sectors
Question. A spinner has scores , , and , with . Find and .
Plan. Use the total probability to find the scale factor, then add the required probabilities.
Why find first? The numbers describe relative weights; they become probabilities only after scaling their sum to .
Answer. and . The distribution is discrete but not uniform.
Check. Its probabilities are , all nonnegative and summing to .
A familiar trap is to divide by the number of values when those values are not equally likely.
Watch out
Four possible scores do not imply . In the second spinner, . Equal probabilities need a reason.
Try the same scaling argument with one extra score. General discrete means and variances are outside this lesson's required calculations.
Building a binomial model
A Binomial variable counts how often one chosen outcome occurs in a fixed number of trials. If a sample contains bulbs, the random variable is the number of defective bulbs, not the condition of one bulb.
Binomial distribution
Write when counts successes in independent trials, each with the same success probability . Each trial is classified as success or failure, and is fixed before the trials begin. The possible counts are .
“Success” is a mathematical label: a faulty bulb can be a success if faults are what you count. A die has six faces, yet “six” versus “not six” gives two classifications. What matters is the event being counted.
Worked example 3: defining a success
Question. A very large production run has a defect probability of per bulb. A random sample of bulbs is inspected. Define , state a Binomial model and give the assumptions about defects.
Plan. Identify one trial, the success event and the fixed number of trials.
Why mention the large run? Sampling a small fraction makes any change caused by removal negligible; it does not by itself rule out faults clustered by machine or time.
Answer. is the number of defective bulbs among the . Use , assuming defect statuses are independent and each sampled bulb has defect probability .
Check. A possible value such as means two faulty bulbs. A value is impossible.
Keep the same sampling situation and change only which outcome is called a success. The complement probability must change with it.
Worked example 4: counting the opposite outcome
Question. In the same sample, is the number of bulbs that are not defective. State a Binomial model and relate to .
Plan. Use the non-defective probability and keep the number of trials unchanged.
Why is now ? It belongs to the event the variable counts, rather than to the story in general.
Answer. , under the same independence and constant-probability assumptions, and .
Check. If two bulbs are defective, are not defective; the two counts total .
When a question asks for an assumption, name it in context: “the bulbs' defect statuses are independent” or “every bulb has the same defect probability”. Saying a probability is “independent” mixes two different ideas.
Exam tip
Write the random variable and distribution, such as . A list of calculator inputs does not state a statistical model.
Now change the probability, still counting the non-defective outcome.
Finding exact binomial probabilities
For eight independent trials, exactly two successes can occur in many different positions. One particular order has probability ; there are such orders.
Binomial probability
For , where is a fixed nonnegative integer and ,
In the formula booklet.
The combination factor counts positions, not extra trials. Here is a pleasing consequence: six fair coins have equally likely head-tail strings, but exactly three heads occurs in of them. Its probability is , while six heads has probability just . Equally likely strings produce unequal count probabilities.
Continue this lesson.
You’re previewing NovaLearn without an account. Create a free account to read the rest.
Create free account