Statistics 2.1 - Single-variable data diagrams
Read histograms, frequency polygons, cumulative frequency diagrams and box plots by identifying what their scales mean. Use them to compare distributions and turn estimated frequencies into probabilities, while keeping track of what grouped data cannot tell you exactly.
What a single-variable diagram shows
Can two equally tall histogram bars represent different numbers of people? Suppose one bar covers times from to minutes and another covers to minutes. Both have height . Their widths differ, so their areas differ: and . The taller-looking feature is not always the larger group.
You already know
A rectangle has area . A proportion is a part divided by the whole. These two familiar ideas do most of the work in this lesson.
A diagram compresses a list. That is useful, but the compression hides some information. In Pearson's weather Large Data Set, the daily mean temperatures at Heathrow in May 2015 fall into the five intervals below. The counts add to , but the table no longer tells you which date had which temperature.
| Temperature, in | |||||
|---|---|---|---|---|---|
| Days | 1 | 7 | 11 | 10 | 2 |
That final class is twice as wide as the others. Drawing its frequency as its height would give it twice the area it deserves. Even a small weather table makes the need for density visible.
Single-variable distribution
A single-variable distribution describes the values of one variable and how often they occur. For example, daily mean temperature at Heathrow is one variable measured on several days. Temperature paired with rainfall is bivariate data instead.
Choose the display for the question you want to answer.
| Diagram | Read from it | What it hides or requires care |
|---|---|---|
| Histogram | Grouped continuous frequencies from bar areas; distribution shape | Heights are densities when class widths differ |
| Frequency polygon | Class midpoints plotted against frequencies and joined in order | Points stand for classes, not individual observations |
| Cumulative frequency diagram | Estimated numbers below values; percentiles | Grouped-data readings depend on interpolation |
| Box-and-whisker plot | Median, quartiles, spread and separately marked outliers | Detailed shape and peaks are hidden |
Key idea
Read the axes and the diagram's conventions before describing the distribution: a height can represent density, frequency or a running total.
Try identifying which display answers a particular question.
Histograms and frequency polygons
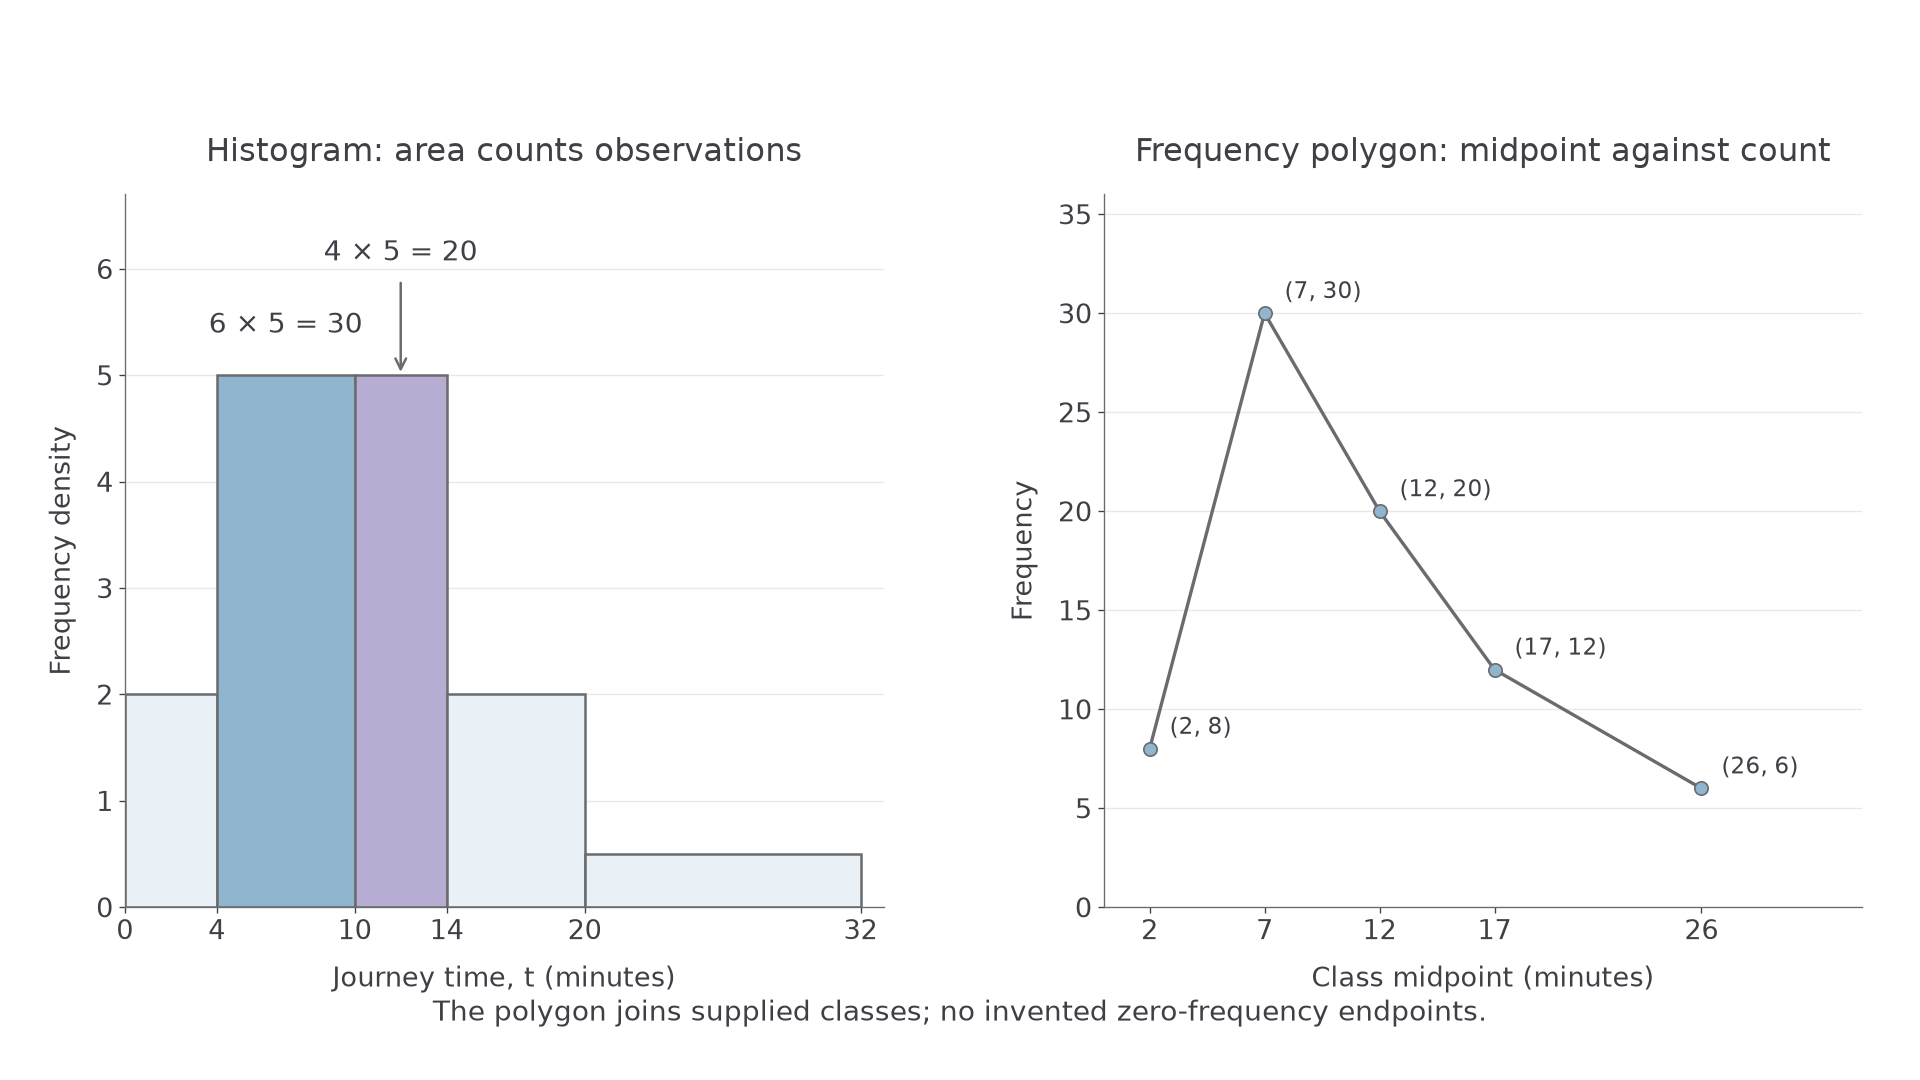
A histogram divides a continuous scale into classes. A bar occupies its whole class interval; adjacent classes meet at their boundaries. Its area represents frequency, so a wider class needs a smaller height for the same frequency.
Histogram area and frequency
For a histogram whose vertical axis is frequency density,
Use true class boundaries. For measurements rounded to the nearest unit, a class labelled – may have boundaries and , not width . Follow the stated measurement convention.
Not in the formula booklet: learn it.
Here is a sample of journey times. These are practice data, rather than weather observations.
| Time, in minutes | |||||
|---|---|---|---|---|---|
| Frequency | 8 | 30 | 20 | 12 | 6 |
| Frequency density | 2 | 5 | 5 | 2 | 0.5 |
[DIAGRAM: asset_name: Histogram areas and frequency polygon for journey times; asset_slug: p3_2_1_interpret_single_variable_data_diagrams__diagram_01; caption: Equal histogram heights need not mean equal frequencies; description: Left histogram has class boundaries 0, 4, 10, 14, 20, 32 and densities 2, 5, 5, 2, 0.5. The two bars of height 5 have areas 30 and 20. Right frequency polygon joins class midpoint and frequency points (2, 8), (7, 30), (12, 20), (17, 12), (26, 6).]
Worked example 1: estimating part of a class
Question. Find the density for , then estimate the number with .
Plan. Divide frequency by width, then add the areas over the requested interval.
Why this step? Splitting the interval at keeps each area inside one bar. Within a class we assume observations are spread evenly.
Answer. The density is , and the estimated count is .
Check. The estimate uses of the observations in the first affected class and all in the next. It lies below their combined frequency .
Change only the requested interval. Now it crosses a boundary where the density changes.
Worked example 2: crossing unequal densities
Question. Using the same table, estimate the number with .
Plan. Split the interval at and calculate each rectangle's area.
Why this step? The density stops at ; extending it to would invent observations.
Answer. About journeys have times in the interval.
Check. These are half of the observations in , plus two-thirds of the in .
A frequency polygon uses the same grouped table differently. Plot class midpoint against class frequency, then join successive points. Here the points are , , , and . Do not mistake these frequency ordinates for the histogram's density heights. Do not invent zero-frequency endpoints when no such classes are supplied.
Watch out
Wrong: the bar of height contains people. Right: the bar from to contains people. If a histogram uses an unlabelled proportional scale, first calibrate area using a known frequency.
Use a new pair of adjacent bars for your own estimate.
Cumulative frequency and box plots
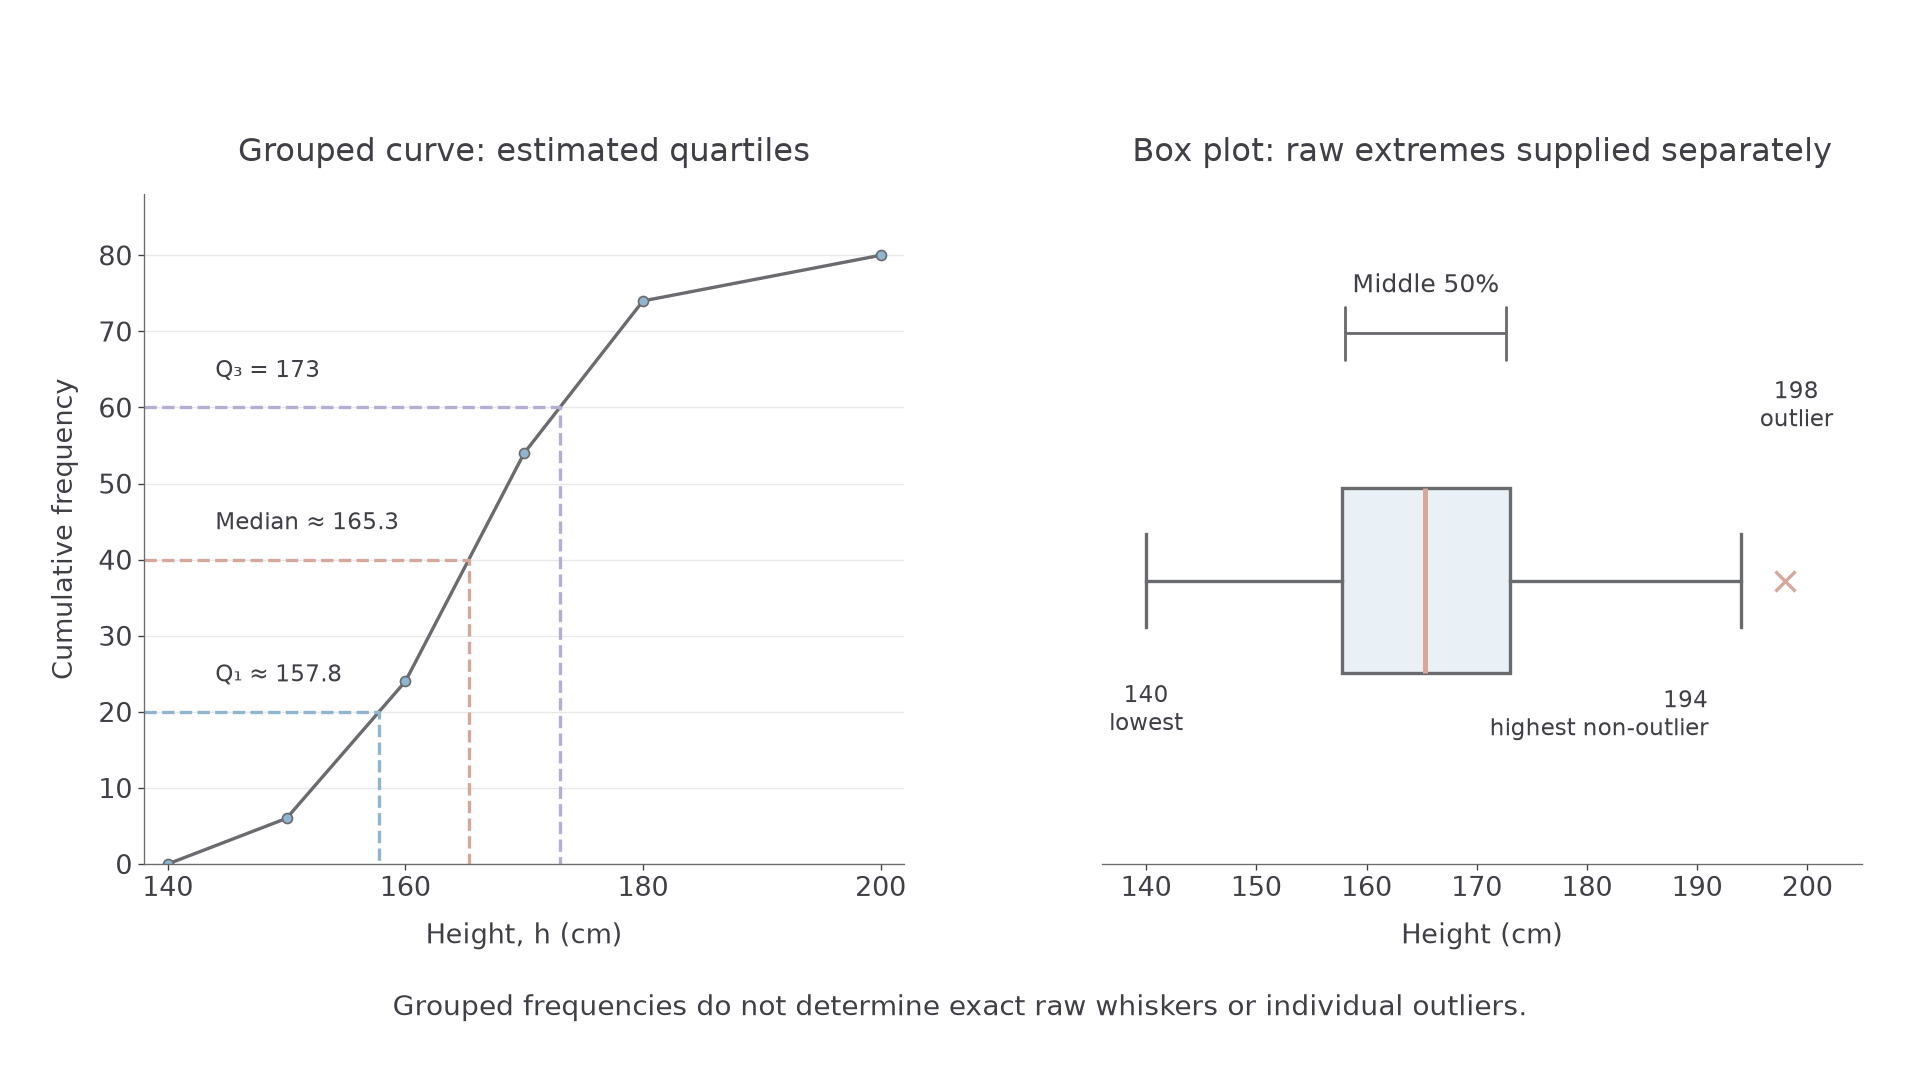
A cumulative frequency diagram answers “How many observations are below this value?” For classes written with an exclusive upper endpoint, add frequencies up to each upper boundary and plot that running total. Start at the lowest boundary with cumulative frequency zero.
For heights, the running totals below are , , , and .
| Height, in | |||||
|---|---|---|---|---|---|
| Frequency | 6 | 18 | 30 | 20 | 6 |
Quartiles and a box plot
The quartiles divide an ordered distribution into four parts: is the lower quartile, is the median and is the upper quartile. A box extends from to , with a line at the median. When outliers are marked separately, the whiskers end at the most extreme non-outlier observations. Check the stated convention before reading a plot.
For grouped data, read at cumulative frequencies , and . A straight segment between successive plotted boundaries assumes an even spread within that class. A smooth drawn curve is also an approximation, not recovered raw data.
Reading between cumulative-frequency points
Between and , linear interpolation at cumulative frequency gives
where and .
Not in the formula booklet: learn it.
The horizontal and vertical guides show the fraction of the class you need.
[DIAGRAM: asset_name: Quartiles from a cumulative frequency graph and a box plot; asset_slug: p3_2_1_interpret_single_variable_data_diagrams__diagram_02; caption: The curve estimates quartiles; the separate box plot needs raw extremes too; description: Left cumulative graph joins (140, 0), (150, 6), (160, 24), (170, 54), (180, 74), (200, 80), with guides at cumulative frequencies 20, 40, 60. Right box plot uses estimated quartiles 157.8, 165.3, 173, and separately supplied raw extremes 140, 194 and outlier 198.]
Continue this lesson.
You’re previewing NovaLearn without an account. Create a free account to read the rest.
Create free account