Pure 2.5 - Linear and quadratic inequalities
An inequality describes every value in a solution set, rather than just the roots of an equation. You will solve linear, quadratic and fractional inequalities, express their intervals clearly, and represent solutions on number lines and coordinate graphs.
Inequalities describe solution sets
Can multiplying an inequality by its unknown make you lose half the answer? In , every negative works, yet an incautious multiplication by suggests only . We will recover the missing interval by keeping track of signs.
You already know
An equation asks where two values are equal. An inequality compares their order: , but . Multiplication by a negative number reverses the order on a number line.
Start with a linear case. Addition and subtraction preserve the inequality sign. Multiplication or division by a positive number preserves it; by a negative number reverses it. These rules are not supplied in the formula booklet.
Solution set
The solution set contains all allowed inputs making the inequality true. For real inputs, . A square bracket includes a finite endpoint; a round bracket excludes it. Infinity is never an included endpoint.
You may abbreviate the set builder to when the domain is clear. Membership says that belongs to ; says it does not. If every member of belongs to , then . The empty set contains no solutions.
Worked example 1: reversing the sign
Question. Solve .
Plan. Isolate the -term, then divide by its negative coefficient.
Why this step? Dividing by a negative reflects the ordered values, reversing their order.
Answer. , or .
Check. gives equality; gives , while gives the false statement .
Change only to . The boundary value stays the same, but it must be excluded.
Worked example 2: a strict endpoint
Question. Solve .
Plan. Perform the same rearrangement, preserving strictness.
Why this step? Reversing the direction does not introduce equality.
Answer. , or .
Check. At , is false, so the endpoint is excluded.
A bounded interval uses and: means and , the intersection . Separate intervals use or, the union . For instance, or is .
Watch out
Wrong: “ and ” for two outside intervals. No number meets both conditions. Use “or” to collect both intervals.
Keep the comparison's direction clear when you collect variables on one side.
Use roots to split a quadratic inequality
For , the factors change sign at and . On each interval between these points, neither factor changes sign, so their product keeps one sign. An upward parabola is positive outside two distinct roots and negative between them.
[DIAGRAM: asset_slug: p1_2_5_solve_linear_and_quadratic_inequalities_in_a_single_variable_and_interpret_such_inequalities_graphically__diagram_01; asset_name: Quadratic signs and a number line; caption: Positive outside the roots and negative between; description: The upward parabola y equals (x plus 2)(x minus 3) crosses at minus 2 and 3. A number line uses open endpoints and highlights x less than minus 2 or x greater than 3 for the strict positive inequality.]
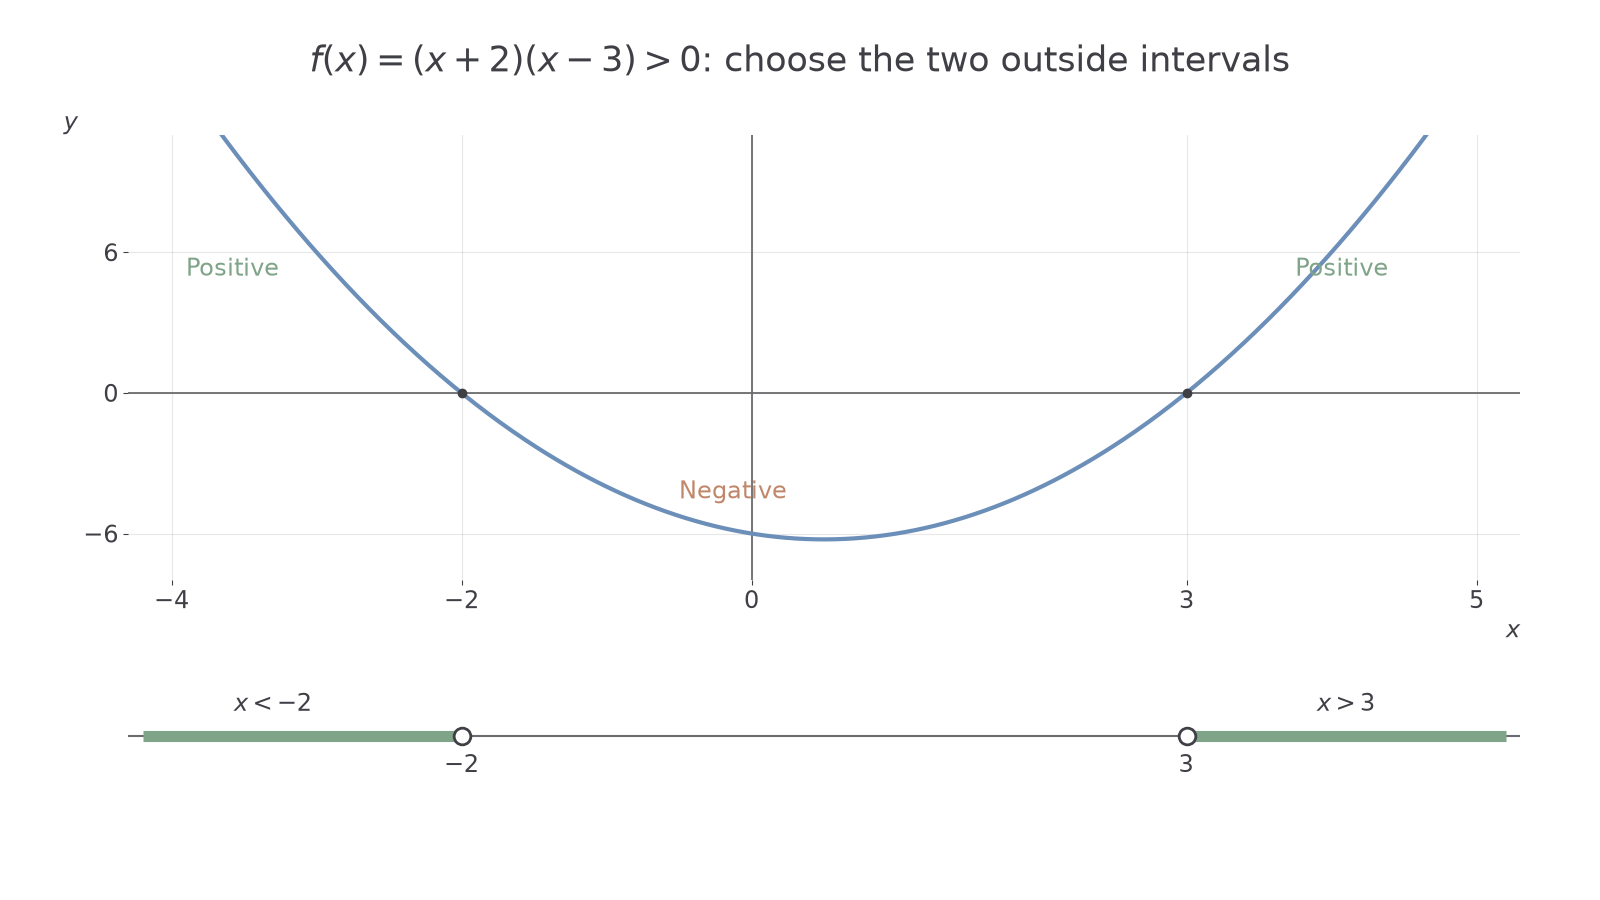
This sign pattern is not a formula in the booklet. Use a sketch or test a point in each interval instead of memorising “between” without checking the leading coefficient. A downward parabola reverses the signs.
Worked example 3: a strict quadratic inequality
Question. Solve .
Plan. Find the roots, then choose where the upward parabola is positive.
Why this step? Roots divide the line into intervals of constant sign; they are boundaries, not the whole answer.
Answer. or .
Check. Test , , : the expression is , , , respectively. The roots themselves give zero and are excluded.
Change only to . The positive intervals remain, and equality adds both roots.
Worked example 4: including the roots
Question. Solve .
Plan. Use the same roots and include the endpoints.
Why this step? At each root the product is exactly zero, which now satisfies the inequality.
Answer. .
Check. Both and give .
Repeated roots need care: holds for all real , while has solution set . A repeated root need not change the sign. Likewise, holds everywhere.
Watch out
Wrong: “The roots are and , so .” That interval gives a negative upward quadratic. Choose the sign requested, using a sketch or a test value.
This time the inequality asks for non-positive values of a different upward quadratic.
Reduce brackets and fractions safely
Brackets usually need expansion and collection. Fractions need an additional decision: is the multiplier definitely positive? If not, multiplying without cases may reverse the inequality for some values and silently lose solutions.
Worked example 5: brackets first
Question. Solve .
Plan. Expand, move everything to one side and factorise the new quadratic.
Why this step? The roots must come from the expression after the comparison with , not the original brackets.
Answer. or .
Check. At either endpoint the original product is ; at , it is , which is excluded.
Change only the comparison to strict ; the algebra is unchanged, but the endpoints leave the set.
Worked example 6: strict bracket inequality
Question. Solve .
Plan. Reduce to the same quadratic and use open endpoints.
Why this step? Subtracting the same constant preserves order, so the new inequality is equivalent.
Answer. or .
Check. gives ; gives , which is false.
For the opening fraction, . Multiplication by has an unknown sign, but multiplication by is safe for every allowed input. Keep excluded after solving.
Worked example 7: an unknown-sign denominator
Question. Solve .
Plan. Exclude zero and multiply by the positive square .
Why this step? A positive multiplier preserves the inequality for negative and positive alike.
Answer. or .
Check. gives ; gives the false statement ; gives .
Change only to . The finite non-zero boundary joins the answer, but zero remains forbidden.
Worked example 8: an exclusion survives equality
Question. Solve .
Plan. Multiply by , solve, then restore the exclusion.
Why this step? The transformed polynomial is defined at zero, but the original fraction is not.
Answer. or .
Check. gives equality; cannot be substituted in the original.
The opening puzzle's missing negative interval has now been recovered. This safe-multiplier method is not supplied in the formula booklet.
Watch out
Wrong: for all . That implication assumes . Use , or split into positive and negative cases and reverse the sign in the negative case.
Try a non-strict fractional inequality with a different numerator and comparison value.
Interpret curve below line inequalities
“Curve below line” compares two outputs at the same input. For and , it means . Subtracting the line's output turns that comparison into the sign of a single quadratic.
[DIAGRAM: asset_slug: p1_2_5_solve_linear_and_quadratic_inequalities_in_a_single_variable_and_interpret_such_inequalities_graphically__diagram_02; asset_name: Curve below a line; caption: Compare outputs between the intersection inputs; description: The curve y equals x squared minus 2x minus 3 is below the line y equals x plus 1 for x strictly between minus 1 and 4. The two intersections mark the excluded endpoints.]
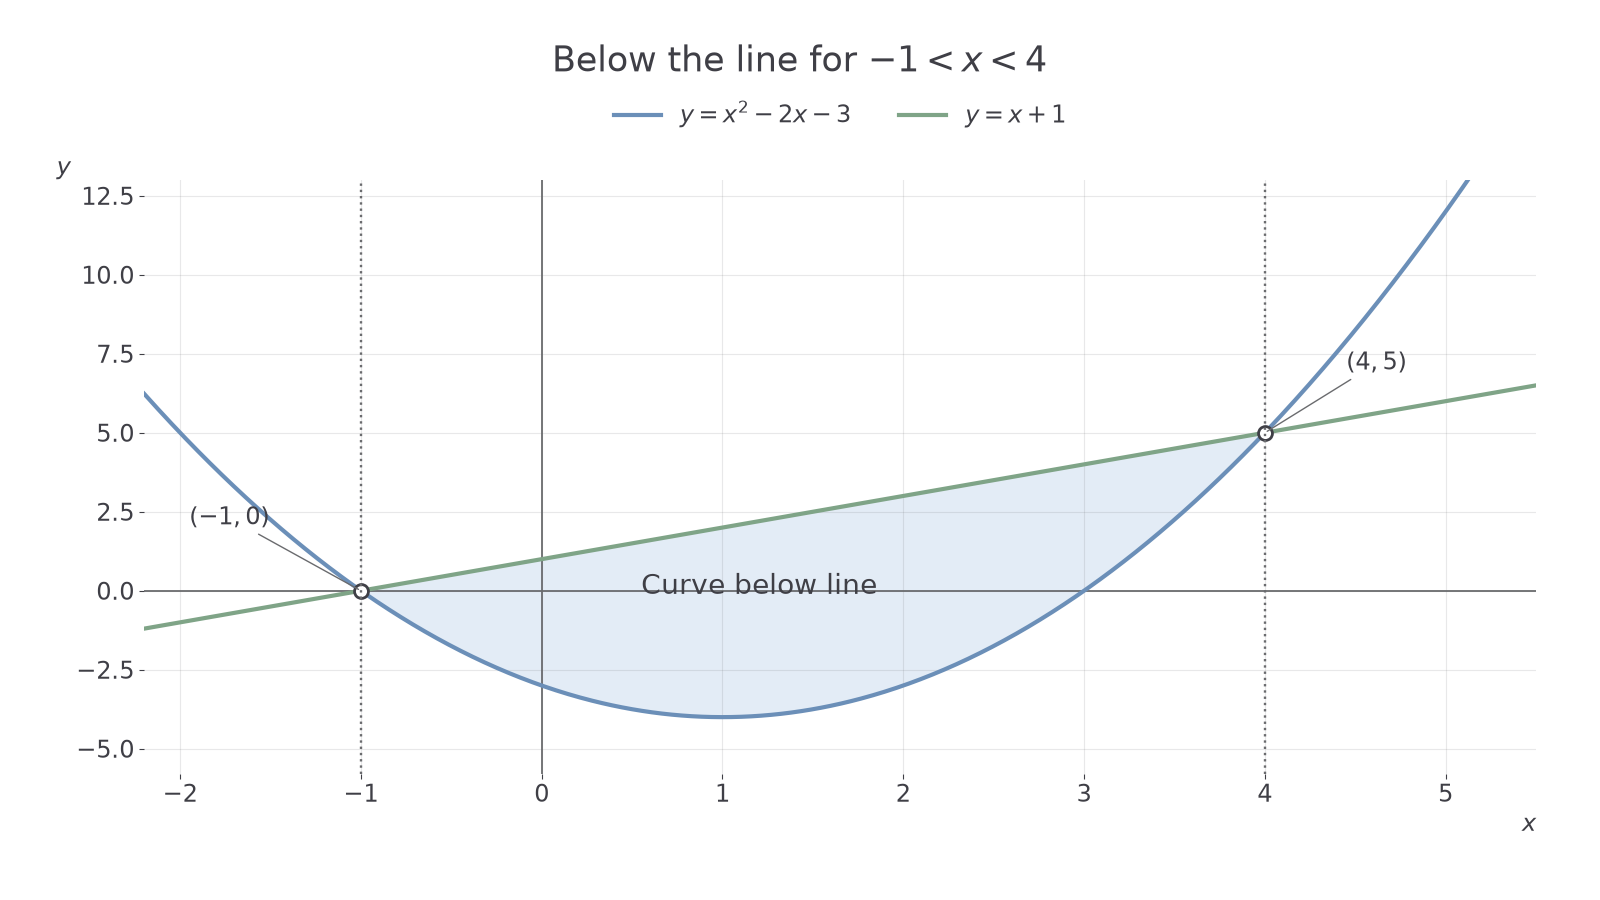
This comparison is not the same as asking where the curve is negative. Both graphs may be positive while one is lower: at , their outputs are and , so the positive curve is below the positive line.
Worked example 9: strictly below
Question. Find where lies below .
Plan. Form the output inequality, collect terms and use its roots.
Why this step? The difference is negative exactly when the curve's output is smaller.
Answer. .
Check. At , ; at , is false.
Change only “below” to “on or below”. The intersection inputs are now included.
Worked example 10: on or below
Question. Find where lies on or below .
Plan. Use a non-strict comparison with the same difference quadratic.
Why this step? Equality means both outputs are equal: the graphs intersect there.
Answer. .
Check. At , both outputs are ; at , both are .
Graph comparisons appear later when you find intersections and areas between curves.
Watch out
Wrong: solving for “curve below the line”. The correct comparison subtracts , giving .
Apply that translation to a different pair of graphs.
Represent inequalities graphically
An inequality in and describes a region of the plane. Replace its sign with equality to find the boundary; then decide whether the boundary belongs and which side to shade. A strict inequality uses a dotted boundary, and an inclusive inequality uses a solid boundary.
[DIAGRAM: asset_slug: p1_2_5_solve_linear_and_quadratic_inequalities_in_a_single_variable_and_interpret_such_inequalities_graphically__diagram_03; asset_name: Boundary inclusion and shaded regions; caption: Dotted excludes equality; solid includes it; description: Side-by-side axes show the region y greater than x plus 1 above a dotted line, and y greater than or equal to x squared minus 2x minus 2 above a solid parabola. Both boundaries have labelled intercepts or turning points and clearly labelled shading.]
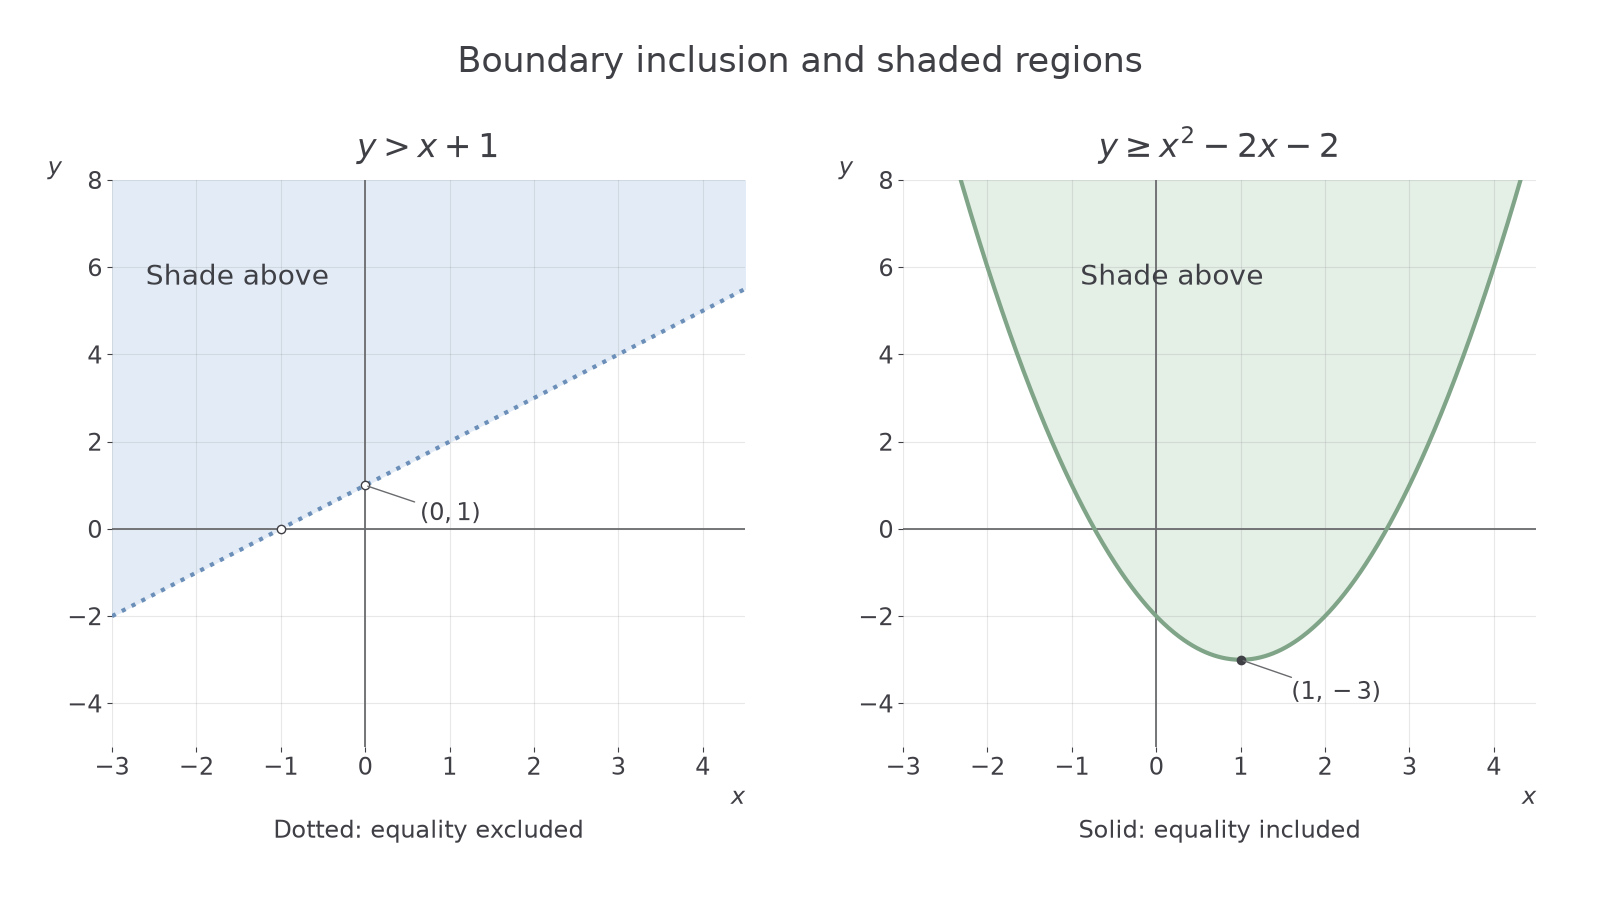
For , shade above the graph; for , shade below it. Test a point away from the boundary if unsure. These conventions are not in the formula booklet.
Worked example 11: a strict linear region
Question. Describe the graph of .
Plan. Locate the boundary line, exclude it, then test the origin.
Why this step? A test point decides the side independently of the drawing's scale.
Answer. Draw a dotted line and shade above it, excluding the line.
Check. is shaded because ; is not.
Change only to . The shaded side remains, and the boundary becomes solid.
Worked example 12: including a line
Question. Describe the graph of .
Plan. Use the same line and include equality.
Why this step? The equality case adds the entire line, not a new shaded side.
Answer. Draw a solid line through , , shading above.
Check. The origin still fails , so it stays unshaded.
A parabola uses precisely the same above-or-below reasoning. Locate its turning point to make the sketch meaningful.
Worked example 13: a strict quadratic region
Question. Describe the graph of .
Plan. Complete the square for the boundary and exclude equality.
Why this step? “Above” compares vertical outputs at each input, even inside a curved region.
Answer. Draw a dotted upward parabola with vertex , shading above it.
Check. is shaded, since ; is not.
Change only to , matching the right-hand panel of the diagram.
Worked example 14: including a parabola
Question. Describe the graph of .
Plan. Keep the same parabola and shading, but include the boundary.
Why this step? A non-strict comparison includes every boundary point, so the whole curve is solid.
Answer. Solid upward parabola with vertex , shading above.
Check. The origin still satisfies .
One last surprising fact about the opening problem: has a broken solution set, although both sides look simple. The forbidden input divides its graph into two branches; algebra must respect that break too.
Watch out
Wrong: shading below because a parabola opens upwards. Its opening tells you the boundary's shape; the inequality sign decides the shaded side.
Use the same boundary-and-side decisions for a downward shaded region.
Quick Recap
- Reverse the sign when multiplying or dividing by a negative number.
- Find quadratic roots, inspect signs between and outside them, then include endpoints only when permitted.
- Preserve denominator exclusions and use a multiplier with a known sign.
- Compare two graphs by subtracting their outputs; use dotted or solid boundaries for planar regions.
For the opening inequality, multiply by with : gives or .