Statistics 1.1 - Populations, samples and sampling techniques
A sample saves work, but the way you choose it determines what you can reasonably conclude. You will define a population, compare a sample with a census, carry out the five sampling techniques, and judge their strengths and limitations in context. Pearson's weather Large Data Set will help you see why the population must be stated precisely.
Population, sample and census
A college can ask students chosen randomly from its full register, or students as they leave the canteen. Which sample gives a sounder basis for estimating the proportion of all students who use the canteen every week? More answers are tempting, but first ask who had a chance to be included.
Suppose the college has students. The investigation concerns all , even though only a smaller group will answer the question. Those two groups have different jobs.
Population and sample
The population is the complete set of people, objects or observations about which information is wanted. A sample is a subset selected from that population. Here the population is all students at the college; the sample is the students selected for the investigation.
Define the population from the question, including its place and time limits. For example, a company investigating April helpline waiting times could make all April calls its population. A sample of selected April calls is not the population. A person calling twice contributes two calls if calls are the units being studied.
Sampling unit and sampling frame
A sampling unit is one individual member of the population that could be selected. A sampling frame is a list identifying the sampling units from which the sample is selected. For the college, one student is a sampling unit and the full student register is a possible frame.
A frame needs checking: an old register might omit new students or include people who have left. Numbering a faulty list does not repair its coverage.
[DIAGRAM: asset_name: A population, its sampling frame and a selected sample; asset_slug: p3_1_1_understand_and_use_the_terms_population_and_sample_and_sampling_techniques__diagram_01; caption: Select the sample from a frame, then direct the inference back to the target population; description: A complete numbered frame for a population of 24 units, a selected sample containing units 2, 5, 8, 13, 17 and 22, and an inference arrow pointing back to the population. The frame lists all units, whereas the sample contains only six.]
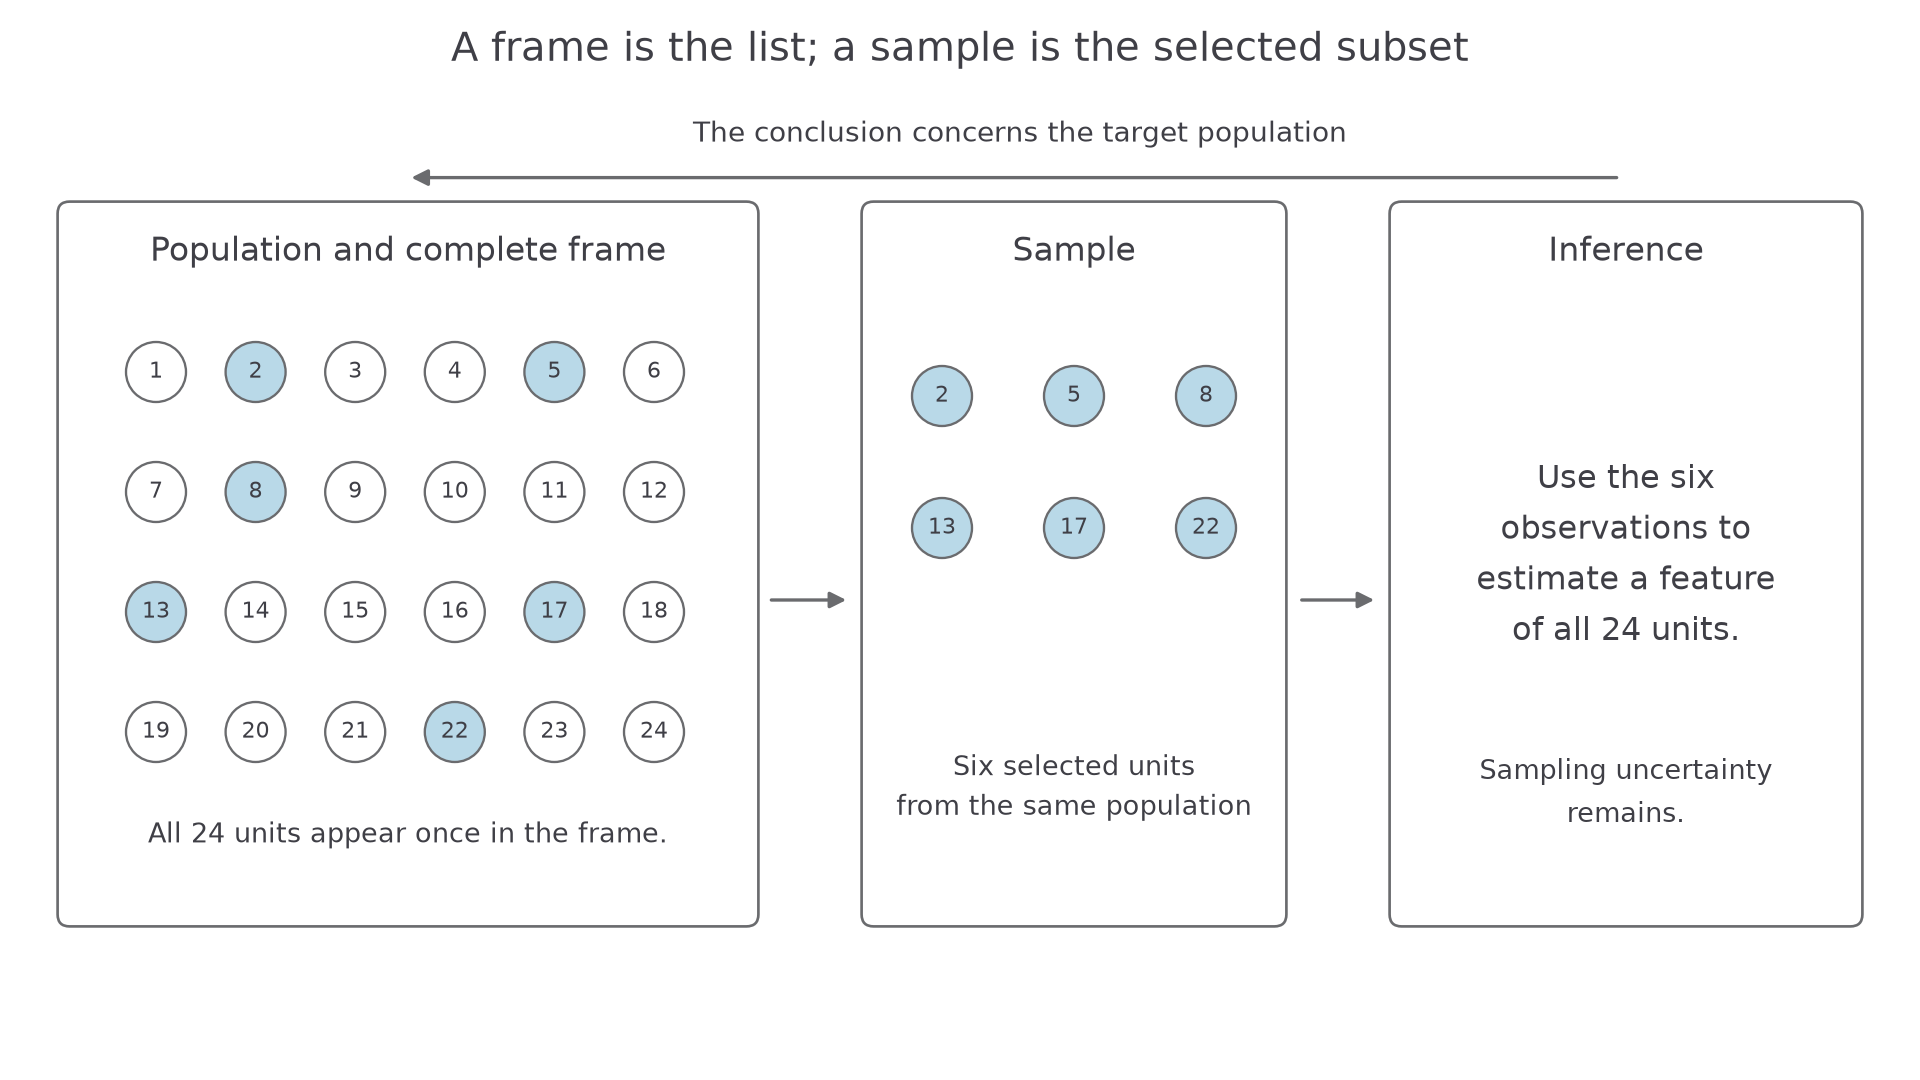
If a researcher selects households from a town's council-tax list to investigate bicycle ownership, the population is all households in the town, the unit is one household, the frame is the council-tax list, and the sample is the selected households. The list is suitable only insofar as it covers the target households accurately.
Census
A census collects data from every member of the population. Asking every student at the college is a census; asking every student in one selected class is still a sample of the college.
The choice depends on the population and the task, rather than on a fixed number of responses.
| Approach | Advantage | Limitation |
|---|---|---|
| Census | No sampling variability; can describe the whole specified population | Often expensive and slow; non-response or measurement errors can still occur |
| Sample | Quicker, cheaper and less data to process; useful when testing destroys the item | Selection can be unrepresentative, and different samples can give different results |
A census can be sensible for a small department. It is impossible to test the breaking strength of every rope and then sell those same ropes intact: the measurement destroys each tested item.
Key idea
The population is the group the question concerns. The frame is the selection list. The sample is the selected subset.
Keep those roles separate in the next check.
Inference and representativeness
A sample result describes the people or observations actually measured; using it to comment on a wider population requires a further judgement.
If of suitably selected students use the canteen weekly, the sample proportion is
You might say, “The sample suggests that about of students use the canteen weekly.” That is an informal inference, not proof that the population proportion is exactly . Another sample can contain a different proportion of canteen users simply by chance.
Representativeness and bias
A representative sample reflects the relevant characteristics of its population. Selection bias occurs when the selection process systematically favours some relevant types of unit over others. For example, asking only canteen users favours students who use the canteen.
A school with students has in Years 7 to 10 and in Years 11 to 13. Asking Year 13 students leaves younger students without any chance of selection. Their travel patterns or lunch choices may differ, so the sample is a weak basis for a claim about the whole school.
Sampling variability is the natural difference between sample results. Bias is a systematic weakness in the selection process. A random sample can be unrepresentative by chance; random selection reduces selection bias but does not guarantee a perfect miniature population.
Consider a gym manager asking the first arrivals between 6 pm and 7 pm on a Monday about their age. The sample is quick to obtain, but excludes morning and weekend users. If those users tend to have different ages, the estimate of the age of all members will be distorted. A larger sample from that same time slot does not remove the exclusion.
Watch out
Wrong: “A sample of is more representative than a sample of because it is larger.” A larger well-selected sample usually reduces sampling variability, but increasing the size of a biased sample does not remove its selection bias.
For example, asking students at a bus stop outside a college of students is likely to overestimate bus use. Asking students at the same bus stop still favours bus users. Tie the criticism to the variable and the target population, rather than stopping at “it is biased”.
Key idea
Different samples can support different conclusions. Judge both the selection process and the uncertainty of the inference.
The next situation asks you to separate those two issues in your own words.
Simple random and systematic sampling
Random selection gives chance, rather than the researcher's preference, control over which units enter the sample.
You already know
A fraction compares a part with a whole. Selecting of units gives a sampling fraction of . A random-number generator can choose labels without choosing people by appearance or availability.
Number a complete frame once, with one distinct label for each unit. Selection must match the actual population: a list with repeated names gives those people extra chances.
Simple random sampling
In a simple random sample of a fixed size, every possible sample of that size has the same chance of selection. Select distinct labels using random numbers, rejecting repeats and labels outside the frame. This is selection without replacement.
For a simple random sample of size from distinct units, each unit has inclusion probability . This is the sample fraction, not the chance of each individual draw when selecting without replacement. It is not a supplied sampling formula in the formula booklet.
Worked example 1: a simple random selection
Question. Describe how to select a simple random sample of products from a batch of , using three-digit random numbers. The random-number stream begins . State the first three selected labels and one practical limitation.
Plan. Label every product, accept only new labels in the valid range, and continue until distinct labels have been accepted.
- Label the products to , so each product occurs once in the frame.
- Accept , reject , accept , reject the repeated , reject , and accept .
- Continue with the same rule until distinct labels have been selected; inspect those products.
Why this rule? Out-of-range labels select nothing, while a repeated label would count the same product twice and reduce the number of distinct units sampled.
Answer. The first three selected products are . Use uniformly generated random numbers for the continuation. A limitation is that the complete labelled batch must be accessible; locating randomly scattered products may take time.
Check. All three labels lie between and , and none is repeated. Every product has inclusion probability .
Now change just the selection rule: keep the same batch and sample size, but use a regular interval after a random start. This is faster to carry out, but changes which combinations of products can occur together.
Systematic sampling
In systematic sampling, choose a random starting point in an ordered frame, then select units at a fixed interval. For example, after a random start of , selecting every tenth product gives .
The following interval rule applies when the population size divides exactly into the required number of selections.
Systematic sampling interval
For units and a sample of , where is a positive integer,
Choose the start randomly from to , inclusive, then add to each selected label to obtain the next, until units have been selected. If is not an integer, a stated adapted procedure is needed; silently rounding need not give the required sample size.
Not in the formula booklet: learn it.
Apply the interval to the same labelled batch.
Worked example 2: a systematic selection
Question. Select a systematic sample of from the same products. The randomly selected start is . State the interval and last selected label, and explain one possible weakness if products are made on a repeating cycle.
Plan. Divide population size by sample size, generate the selected labels from the start, then compare the interval with any production pattern.
Why start randomly? Choosing a preferred start would let the inspector favour a particular position in the production cycle.
Answer. The interval is , and the last label is . The method is easy to implement and spreads selections through the batch. However, if the process repeats every products, all selections occupy the same position in that cycle, which could make the sample unrepresentative.
Check. selected products, and the next label, , is beyond the batch.
For comparison, daily readings sampled every twelfth reading from start give , a sample of . A genuine random-start design chooses that start randomly from to . Calling a fixed-interval selection “systematic” identifies its pattern; describing a sound selection procedure also needs the random start.
Here is a surprising boundary: equal inclusion chances alone do not make a sample simple random. From labels , systematic sampling of two with interval chooses either or , each with probability . Every label has chance , yet only two of the six possible pairs can occur. A simple random sample would allow all six equally.
Watch out
Wrong: “Systematic sampling is simple random because each unit has an equal chance.” Equal individual chances do not make every possible sample equally likely. Also check for a repeating pattern in the ordered frame.
The distinction matters when days, shifts or production cycles repeat. Use both the interval and the context in your answer.
Stratified sampling
When groups may differ in a way relevant to the investigation, deliberately represent each group and randomise within it.
A sixth form has Year 12 students and Year 13 students. Year 12 makes up of the population, so a proportional sample of should take of its members from Year 12.
Stratified sampling
Divide the population into non-overlapping groups called strata, with every unit in exactly one stratum. Take a random sample from each stratum, usually in proportion to its population size. For example, year group can be the stratum when travel patterns may vary by age.
The population proportion determines the allocation; it does not select the individuals.
Proportional stratified allocation
If a population of units is divided into strata, a stratum containing units receives an ideal allocation
in a sample of size . Allocate whole numbers totalling , then select randomly without replacement within each stratum. The allocation requires known stratum sizes and identifiable membership.
Not in the formula booklet: learn it.
Begin with allocations that are already whole numbers.
Worked example 3: exact proportional allocations
Question. A sixth form has Year 12 students and Year 13 students. Describe how to select a proportional stratified random sample of by year group.
Plan. Calculate the share for each year, then use a separate random selection from each year's list.
Number each year's list and use random numbers to select distinct Year 12 students and distinct Year 13 students.
Why randomise separately? The allocation controls each year's representation, while random selection within each year prevents the teacher choosing only convenient students.
Answer. Randomly select students from Year 12 and from Year 13, without replacement within each year.
Check. , and , so Year 12 has the same proportion in the sample and population.
Continue this lesson.
You’re previewing NovaLearn without an account. Create a free account to read the rest.
Create free account