Statistics 2.4 - Outliers in data sets
Recognise possible outliers, apply a supplied numerical rule and interpret unusual points on diagrams. Clean missing values, coding issues and genuine errors without automatically deleting valid extremes, and explain how those decisions affect the conclusions.
An outlier is a flag to investigate
Should a very wet day be deleted just because most days were much drier? Pearson's Large Data Set records at Heathrow on 26 August 2015. That is a real entry in the supplied data, rather than a made-up mistake. An unusual rainfall value may describe the very event you need to study.
You already know
The IQR is . A standard deviation measures spread about a mean. To use a strict inequality such as , the boundary value itself does not qualify.
A flag tells you which record to investigate, not whether the instrument or typist was wrong. Check the original record, units, weather conditions and intended population before deciding. A rainfall reading of among small values could be a storm or a recording error; its size alone cannot distinguish them.
Possible outlier
A possible outlier is an observation unusually far from the other values or from a relationship's main pattern, or one that meets a stated numerical rule. It can be a genuine extreme observation. A missing entry is not an unusually large or small numerical value, so it is not an outlier merely because it needs attention.
Any numerical identification rule needed in an examination is supplied. Read its multiplier, whether it is one-sided or two-sided, and whether its endpoints are included. Do not silently substitute a favourite rule. The conclusions here are informal interpretations, rather than a new significance test.
Key idea
Apply the supplied rule, then investigate in context. “Possible outlier” and “incorrect observation” are different conclusions.
Decide what the mathematics can establish on its own.
Using IQR fences
An IQR rule measures how far an observation lies beyond the central box, using quartiles rather than a mean that an extreme value can pull.
IQR and a supplied fence rule
In the formula booklet.
A question might define outliers as values more than IQR below or above . That particular choice of multiplier is a supplied rule, not a universal definition.
Fences when the multiplier is 1.5
Under that stated rule,
Possible outliers satisfy or . If the wording changes, follow its inequalities and multiplier.
Not in the formula booklet: learn it.
The fences are comparison thresholds. They are not normally the ends of a box plot's whiskers.
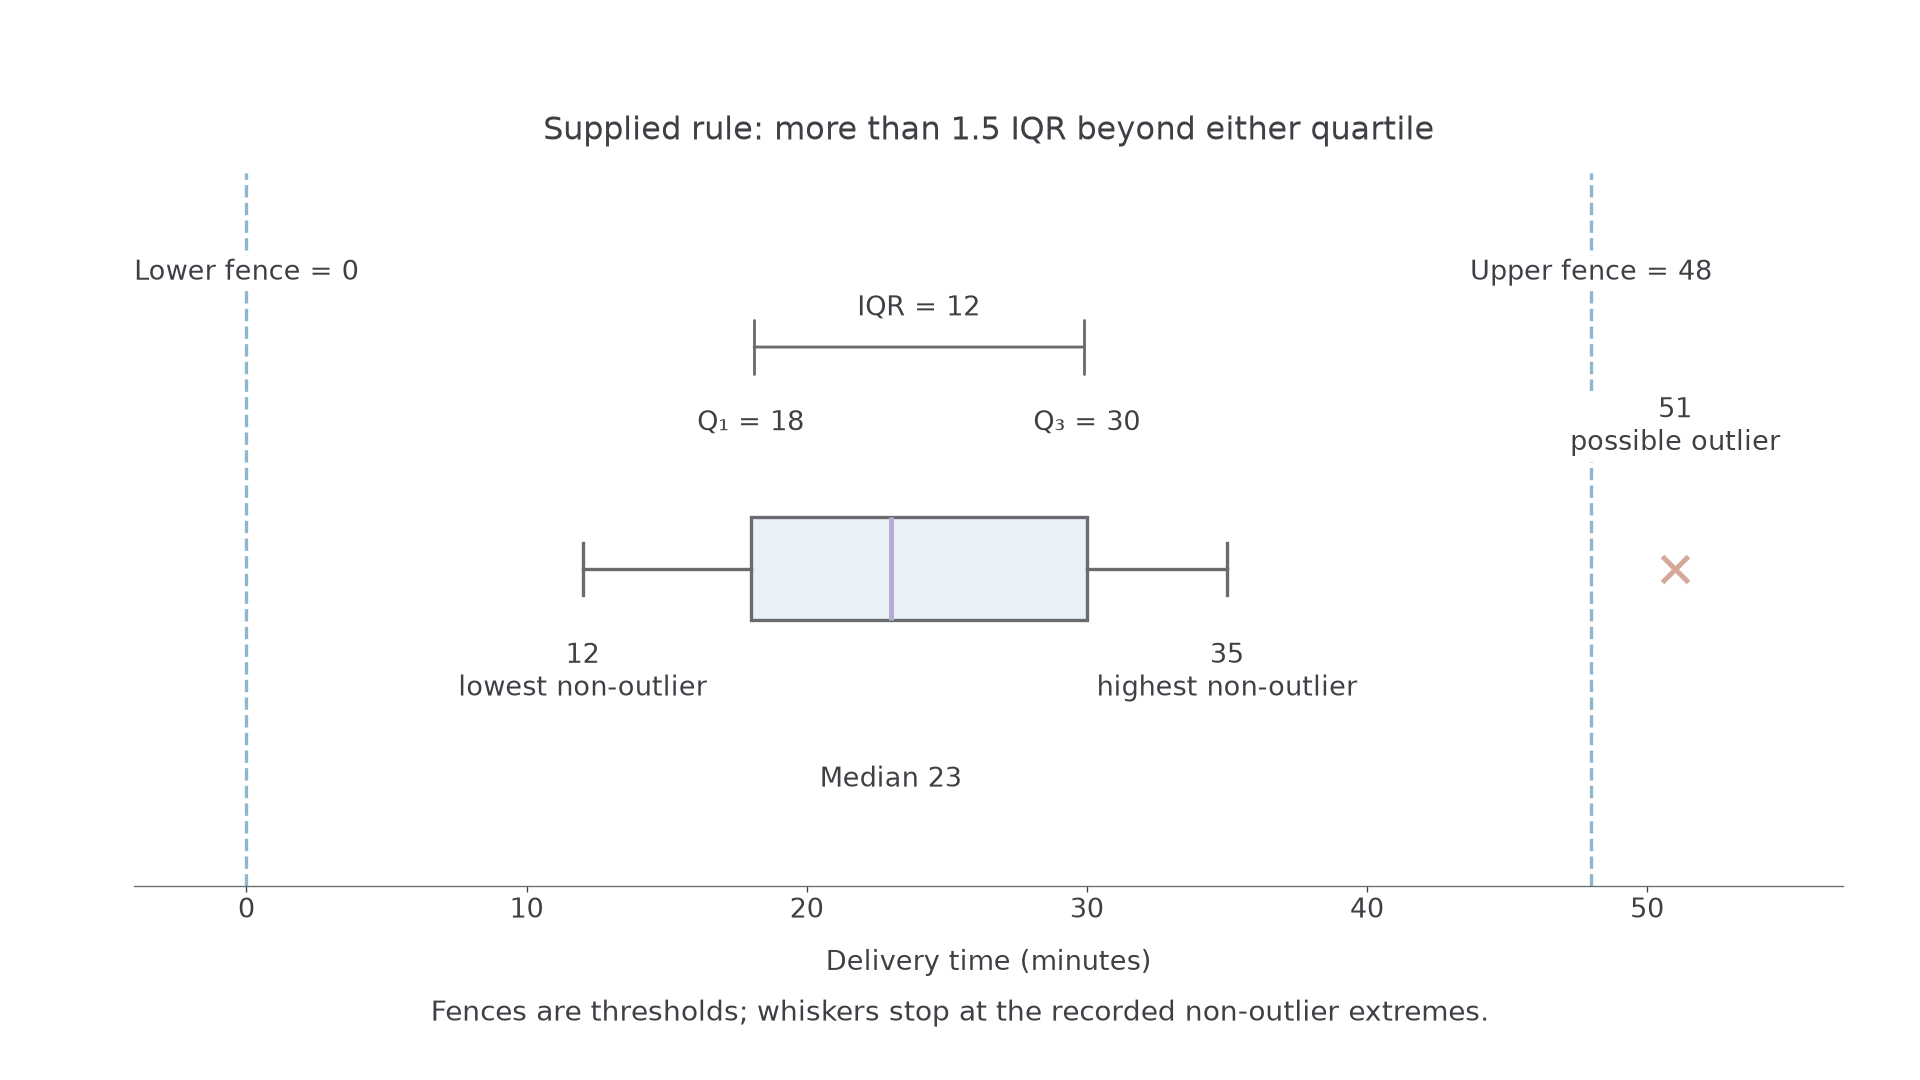
[DIAGRAM: asset_name: Quartile fences and raw-data whiskers; asset_slug: p3_2_4_recognise_and_interpret_possible_outliers_in_data_sets__diagram_01; caption: The upper fence is 48, but the upper whisker ends at the largest non-outlier, 35; description: Horizontal box plot has lower whisker 12, Q1 18, median 23, Q3 30, upper whisker 35 and separately plotted outlier 51. Dashed fences at 0 and 48 are labelled above; the IQR bracket spans 18 to 30 above the plot.]
Worked example 1: testing a high value
Question. Delivery times have and minutes. The rule flags values more than IQR below or above . Determine whether minutes is an outlier.
Plan. Calculate the IQR, then the relevant upper fence and compare.
Why this step? The distance starts at ; it is not itself the upper fence.
Answer. minutes is an outlier under the stated rule. It may still be a genuine delayed delivery.
Check. The lower fence is . The numerical interval between fences is , with outside.
Change only the tested value, from to the boundary . The strict wording now matters.
Worked example 2: a value on the fence
Question. With the same quartiles and rule, determine whether minutes is an outlier.
Plan. Use the same fence and test the strict inequality.
Why this step? “More than” excludes equality; an observation exactly IQR above is not more than that distance away.
Answer. minutes is not an outlier under this rule.
Check. Its distance above is , exactly the threshold.
In the diagram the largest non-outlier observation is , so the upper whisker ends there, even though the fence is . A fence need not be a recorded value. If a plot uses a different stated whisker convention, read that convention explicitly.
Watch out
Wrong: compare with . Right: compare it with . The quartile establishes where the extra distance starts.
Use fresh quartiles and keep the strict comparison visible.
Using mean and standard deviation
A second kind of rule measures distance from the mean in standard deviations. Its multiplier is supplied too. A lower-only rule is not the same as a two-sided rule.
A supplied three-standard-deviation rule
If a question defines possible outliers as more than three SDs from mean , with SD , use
For a rule referring only to values below the mean, use only the lower inequality. This is the stated example rule, rather than a compulsory rule for every dataset.
Not in the formula booklet: learn it.
Means and SDs can themselves change when an extreme observation is added. That is another reason to treat a flag as a prompt to investigate rather than proof of an error.
Worked example 3: a two-sided rule
Question. Rod lengths have mean and SD . A possible outlier is more than three SDs from the mean. Test .
Plan. Find both limits and locate the observation relative to them.
Why this step? A two-sided rule can flag either unusually short or unusually long rods.
Answer. The rod is a possible outlier.
Check. Its distance from the mean is , greater than .
Change only the rule's direction. The same long rod will not meet a rule concerned only with unusually short rods.
Worked example 4: a one-sided rule
Question. With the same mean and SD, a new rule flags only lengths more than three SDs below the mean. Test again.
Plan. Calculate the lower limit and apply only the lower inequality.
Why this step? The rule's purpose determines which side counts; computing an upper limit cannot override the word “below”.
Answer. is not flagged by this lower-only rule.
Check. The observation is above the mean, so it cannot be more than three SDs below it.
A one-sided rule can be appropriate when investigating unusually low measurements, but the question supplies that choice. Keep the threshold's units when interpreting it.
Watch out
Wrong: “Anything more than three SDs above or below is an outlier” when the question says “below”. Right: translate the wording into its particular inequality before substituting.
Test a new observation against a lower-only rule.
Continue this lesson.
You’re previewing NovaLearn without an account. Create a free account to read the rest.
Create free account