Pure 6.1 - Exponential functions and graphs
Read exponential graphs from their equations: recognise growth and decay, use the natural base , and find the intercept, range and asymptote after a transformation. A few exact points will tell you more than a screenful of rounded calculator values.
The multiplicative meaning of
Can a curve fall for ever and still stay above a horizontal line? Start with . Moving one step to the right multiplies the height by ; moving left divides it by .
You already know
For , , , and is the positive root of of order . The variable in is the exponent; in it is the base.
Fractional and irrational exponents fill the gaps between the integer inputs. A positive base gives one positive real output at every real input.
Exponential function
The non-constant exponential function has a fixed base , , and a real variable exponent . For example, is exponential; is a power function. The allowed positive-base boundary gives the constant function , rather than growth or decay.
The index laws explain how to build a table without retyping every power.
Equal steps give equal factors
For and real and ,
In particular, increasing by multiplies the output by .
Not in the formula booklet: learn it.
Try the same calculation with a base below .
Worked example 1: reciprocal-base points
Question. Find the exact points on at .
Plan. Substitute each input, using the reciprocal rule for the negative power.
Why this step? A negative exponent reverses multiplication; it does not make the output negative.
Answer. , , and .
Check. Each successive height is the previous height multiplied by : .
Change only the base to its reciprocal. The same inputs now produce growth rather than decay.
Worked example 2: reversing the base
Question. Find the exact points on at .
Plan. Use the same three index rules as before.
Why this step? Keeping the inputs fixed isolates the effect of changing the base.
Answer. , , and .
Check. These heights reverse the first table: , so the graphs reflect in the -axis.
The point at zero survives every change of positive base.
Watch out
Wrong: . Right: . A positive base raised to any real power stays positive. A negative base such as cannot define a real-valued graph for every real input, since is not real.
Now change the base once more and make the points exact.
Growth and decay shapes
A base of doubles each height; a base of halves it. Neither operation can turn a positive height into zero.
[DIAGRAM: asset_slug: p1_6_1_know_and_use_the_function_ax_and_its_graph_where_a_is_positive__diagram_01; asset_name: Growth and decay exponential graphs; caption: Reciprocal bases reverse the direction; description: Two panels compare y equals 2 to the power x and y equals one half to the power x. Both pass through (0,1), remain above the x-axis and approach the horizontal asymptote y equals 0.]
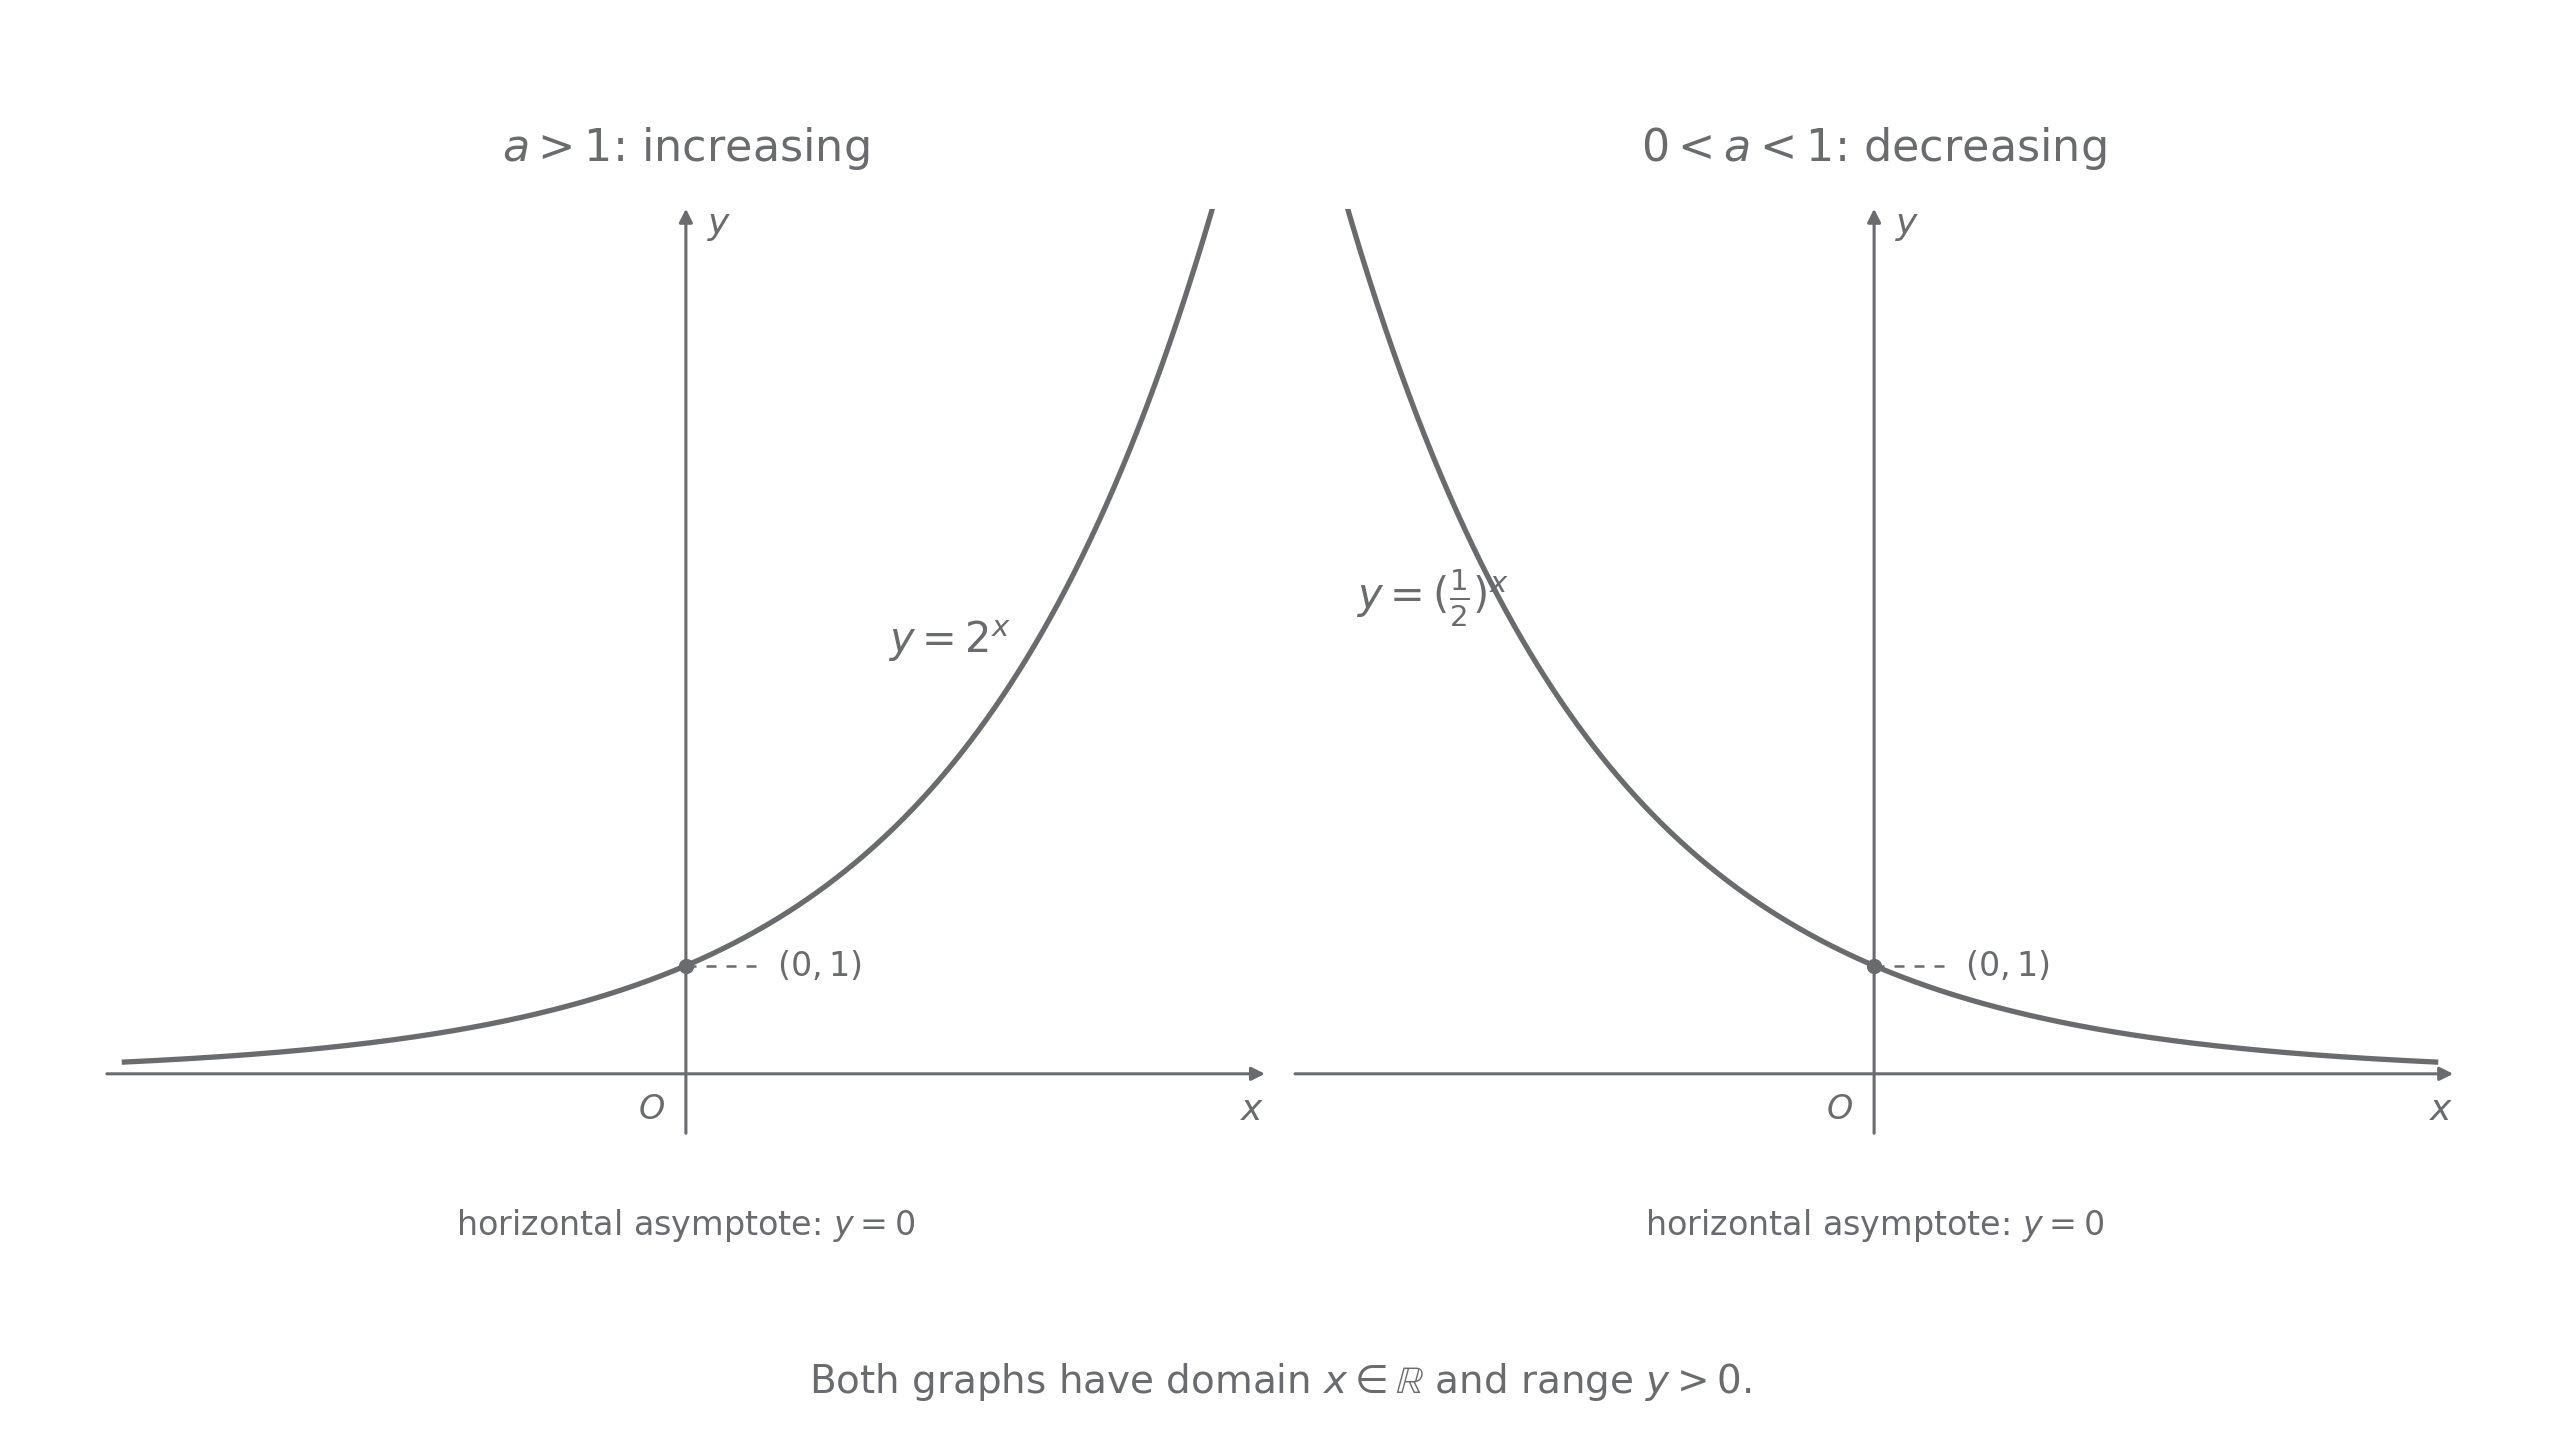
Horizontal asymptote
A horizontal line is an asymptote when a curve's height approaches as the input goes indefinitely in one direction. For , with , , the line is . These particular curves never reach it.
Read the ends of the graph as well as its middle. These graph facts are not in the formula booklet: learn them.
| Feature | ||
|---|---|---|
| Direction as increases | increasing | decreasing |
| End approaching | ||
| Domain | all real | all real |
| Range | ||
| -intercept |
Worked example 3: describing decay
Question. Describe the direction, intercept, range and asymptote of .
Plan. Compare the base with , then use positivity and the value at zero.
Why this step? The base is positive but below ; “positive base” alone does not mean growth.
Answer. Decreasing; intercept ; range ; horizontal asymptote , approached to the right.
Check. At , the heights are : smaller but still positive.
Change only the base from to . This reverses the direction, while the common features stay the same.
Worked example 4: describing growth
Question. Describe the same four features for .
Plan. Use for direction and for the intercept.
Why this step? Negative inputs explain the left-hand tail; the curve has no negative outputs.
Answer. Increasing; intercept ; range ; horizontal asymptote , approached to the left.
Check. The first part's table has heights , in increasing order.
A sketch should preserve these exact features even when its scale is approximate.
Watch out
A calculator display of for a very small exponential value is rounding or underflow. It is not an intercept. For example, .
Change the growth base to for your own description.
The natural exponential
The base lies between and , so has the growth shape you already know. Its exact points include , , and .
Natural exponential
The natural exponential function is , where . It has domain all real numbers, range , intercept , and horizontal asymptote . These graph facts are not in the formula booklet: learn them.
Continue this lesson.
You’re previewing NovaLearn without an account. Create a free account to read the rest.
Create free account