Mechanics 7.2 - Kinematics graphs in straight-line motion
Read a motion graph as information about gradients, areas and direction. You will use displacement-time and velocity-time graphs to solve straight-line journeys, including reversals and journeys with several stages.
The graph language of motion
Can a graph slope downwards while the particle still moves forwards? Yes: a velocity decreasing from to stays positive. The downward slope describes acceleration, not direction of motion.
You already know
Displacement and velocity are signed. Distance and speed are nonnegative. A straight-line gradient is rise divided by run.
Read both axis labels before giving a physical meaning to that gradient.
Kinematics graphs
A displacement-time graph plots signed displacement against time . A velocity-time graph plots signed velocity against . A speed-time graph plots , so it cannot go below the time axis.
Units reveal what a gradient or area measures.
| Graph | Gradient | Area between graph and time axis |
|---|---|---|
| Displacement-time | Velocity: | No standard kinematic quantity here |
| Velocity-time | Acceleration: | Signed displacement: |
| Speed-time | Rate of change of speed | Distance travelled |
A graph is a record of motion over time, not a drawing of the road. A horizontal displacement-time line means rest; a horizontal velocity-time line can mean steady travel.
Key idea
Graph height gives the vertical-axis quantity. Gradient and area give different information.
Diagnose the interpretation before calculating.
Reading displacement-time graphs
A displacement rising from to over gives an average velocity of . If that graph section is straight, its velocity is constant.
Velocity as a gradient
A straight section has this constant velocity. On a curve, the tangent gradient gives instantaneous velocity and a chord gradient gives average velocity. Not in the formula booklet: learn it.
Positive, zero and negative gradients correspond to forward motion, rest and backward motion relative to the chosen positive direction.
[DIAGRAM: asset_slug: p3_7_2_understand_and_interpret_kinematics_graphs_in_straight_line_motion__diagram_01; asset_name: Displacement-time gradients; caption: Positive, zero and negative gradients give the three velocity signs; description: Three displacement-time graphs show positive gradient, a horizontal line and negative gradient, with clear axes and velocity interpretations.]
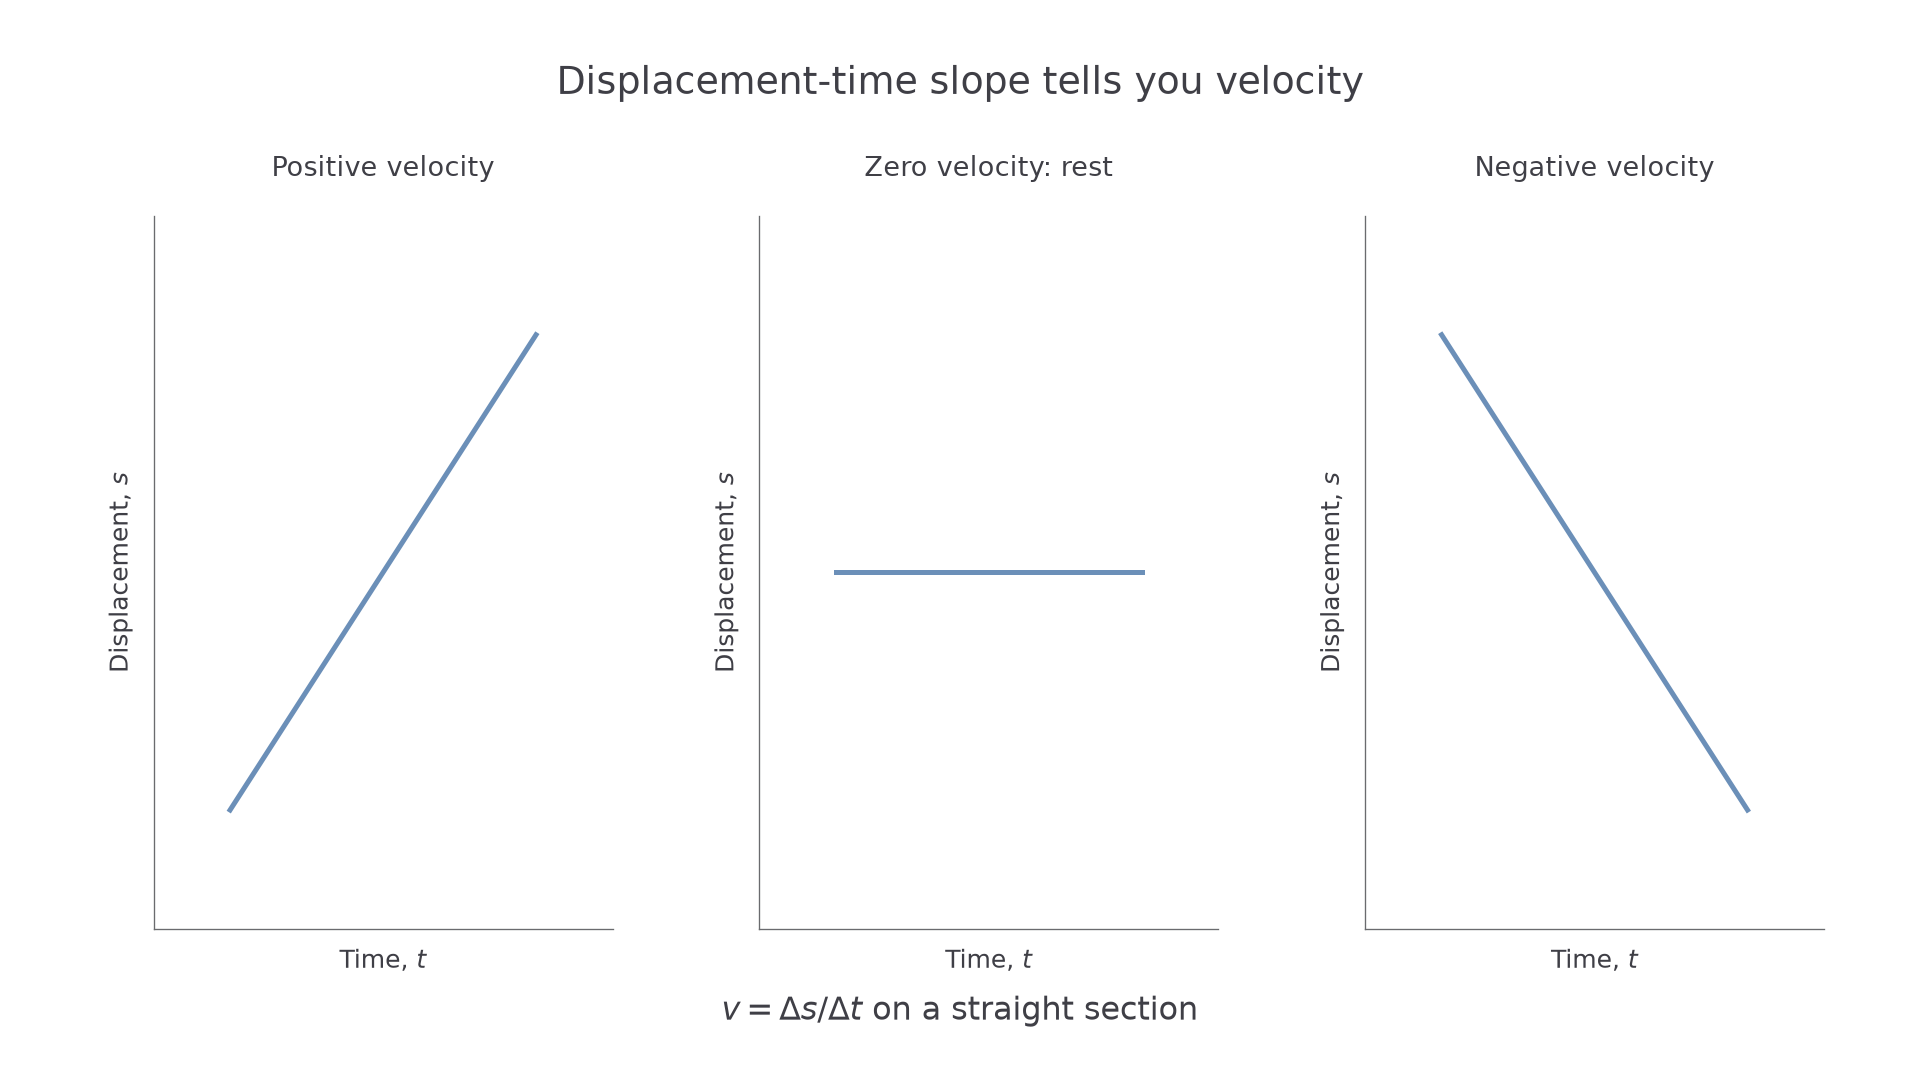
Choose points far apart on a straight section to reduce reading error.
Worked example 1: a positive gradient
Question. A straight displacement-time section joins and , with time in seconds and displacement in metres. Find velocity.
Plan. Divide the change in displacement by the change in time.
Answer.
Why subtract both coordinates? The gradient describes change over the interval, not displacement divided by the final time.
Check. In , velocity adds , matching the rise.
Change only the second displacement from to .
Worked example 2: a negative gradient
Question. A straight section joins and . Find velocity and interpret its sign.
Plan. Use the same coordinate differences in the same order.
Answer.
The particle moves in the negative direction. Why can the final displacement be negative? It has passed the origin; its velocity comes from slope, not height.
Check. .
For a curved graph, draw or use the supplied tangent at the requested time and calculate its gradient with two points on the tangent. Those points need not lie on the curve. For example, tangent points and give instantaneous velocity .
Watch out
Graph height is displacement. Using the height as velocity ignores the rate at which displacement changes.
Keep the first point and change only the second displacement again.
Reading velocity-time graphs
A velocity-time graph carries two pieces of information: slope tells you how velocity changes, while signed area adds the displacement accumulated during the interval.
Gradient and signed area
A tangent gives instantaneous acceleration on a curve. Areas below the axis count negatively for displacement; add absolute areas for distance. Not in the formula booklet: learn it.
The small rectangle idea explains the area rule: approximately constant velocity over a short interval contributes displacement . Adding such contributions gives area.
[DIAGRAM: asset_slug: p3_7_2_understand_and_interpret_kinematics_graphs_in_straight_line_motion__diagram_02; asset_name: Velocity-time gradient and signed area; caption: A slope measures acceleration and signed areas measure displacement; description: A gradient triangle is shown separately from a piecewise velocity-time graph with positive and negative shaded regions.]
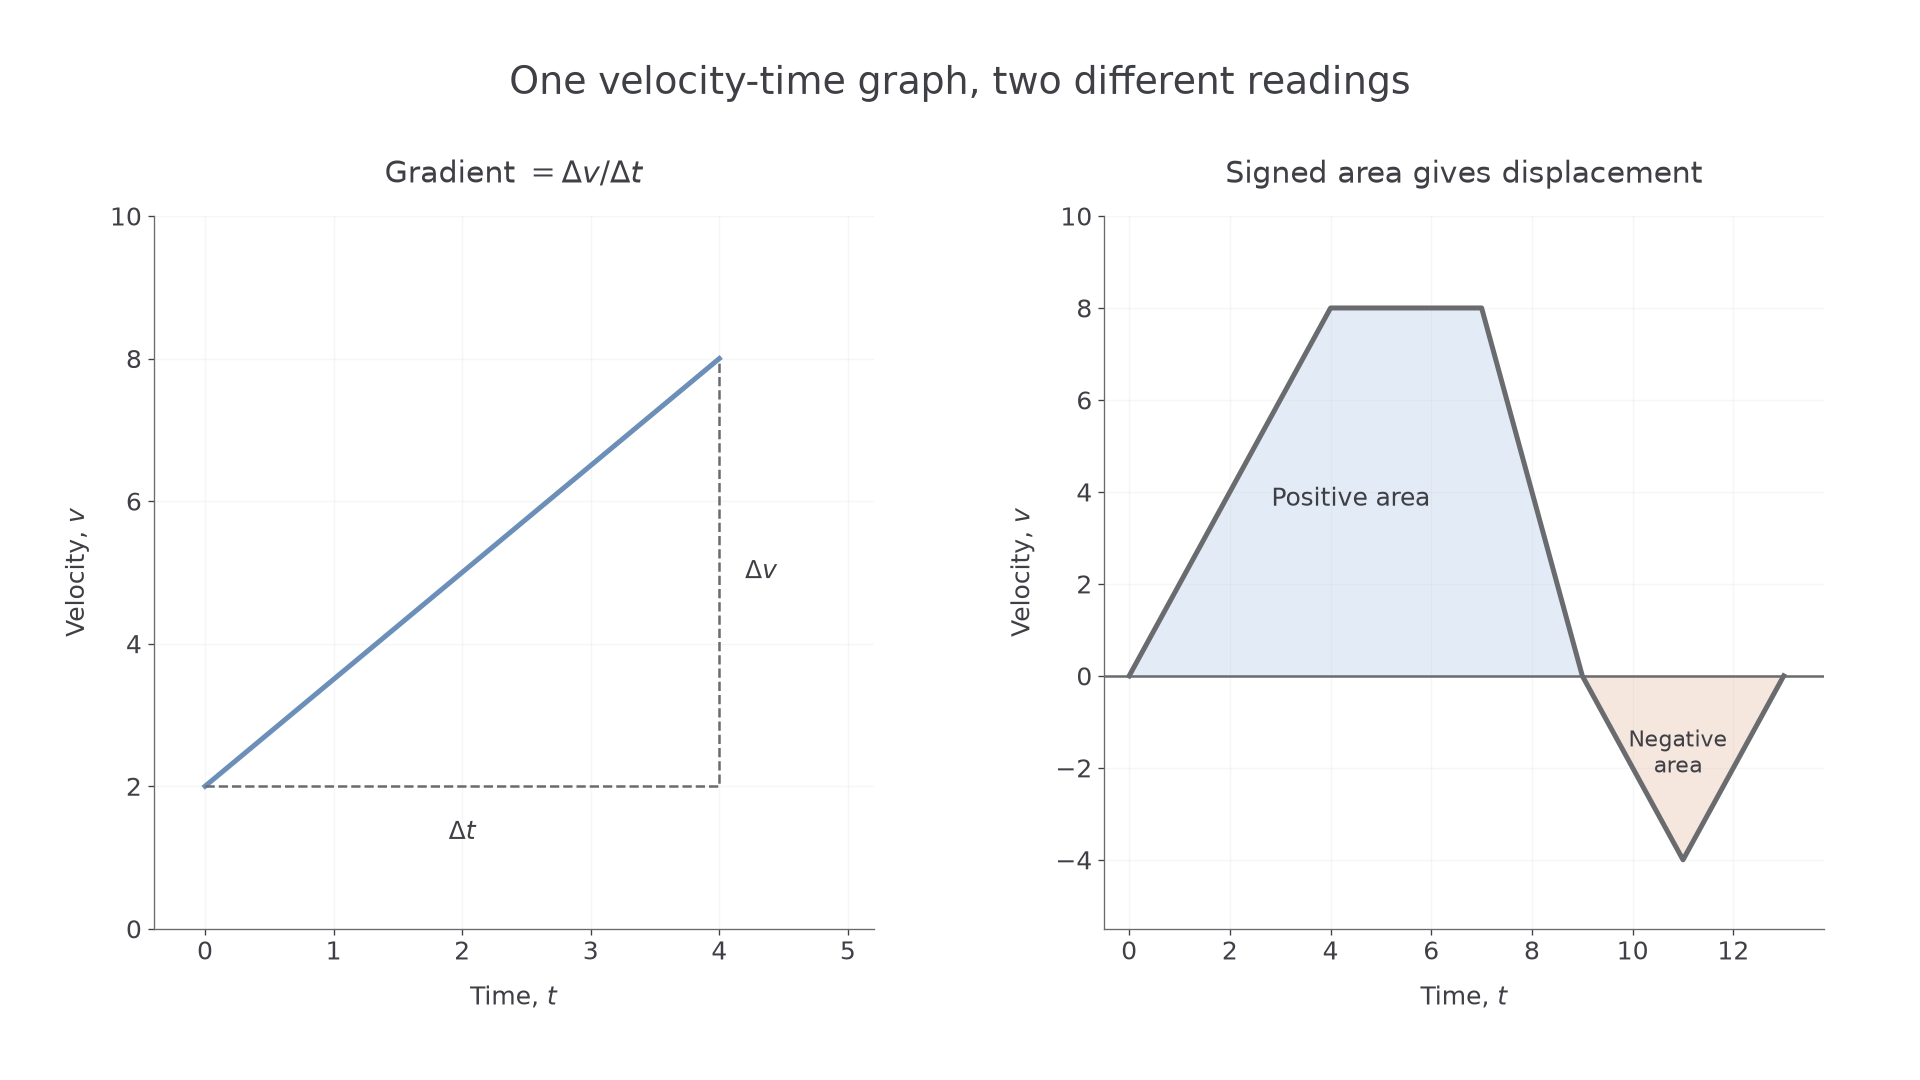
Start with a straight graph that crosses the axis.
Worked example 3: an axis crossing
Question. Velocity decreases linearly from at to at . Find acceleration, displacement and distance.
Plan. Find slope and the zero-velocity time, then calculate both triangle areas.
Answer.
Why split at ? Velocity changes sign there, so the particle reverses.
Check. The signed trapezium area is .
Change only the final velocity to .
Worked example 4: equal opposite areas
Question. Velocity decreases linearly from to over . Find acceleration, displacement and distance.
Plan. Use symmetry for the crossing time and keep signs for displacement.
Answer.
Why is distance nonzero? Opposite displacements cancel, but both path lengths count.
Check. The average velocity on this straight section is .
Continue this lesson.
You’re previewing NovaLearn without an account. Create a free account to read the rest.
Create free account