Statistics 3.3 - Probability modelling and assumptions
A probability calculation is only as useful as its assumptions. You will build and compare models, use observed evidence carefully, and explain how changing fairness, independence or constant-probability assumptions changes a prediction.
Probability models and assumptions
If a coin is slightly more likely to land heads, does every familiar fair-coin prediction become larger? Start with four tosses: the fair independent model gives equally likely sequences, and contain at least three heads. We will change the assumption and see which predictions rise and which fall.
You already know
Multiply conditional probabilities along a path and add disjoint paths. Independence allows the same success probability after either earlier outcome.
A model is a deliberate simplification, rather than a claim that every detail of the world has been captured.
Probability model
A probability model specifies possible outcomes, their probabilities and assumptions linking them. Probabilities must lie between and ; probabilities of all separate exhaustive outcomes must sum to .
Fairness means equally likely outcomes: for a coin , while for a fair die every face has probability . Independence is a separate assumption about how trials relate. A fair coin need not produce independent results in a badly designed experiment.
[DIAGRAM: asset_slug: p3_3_3_understand_and_model_with_probability_including_critiquing_assumptions__diagram_01; asset_name: Statistics 3.3 - Probability modelling and assumptions - diagram 01; caption: Predictions feed back into assumptions through evidence; description: The modelling cycle moves from real situation through assumptions, probability model, prediction, evidence and refinement.]
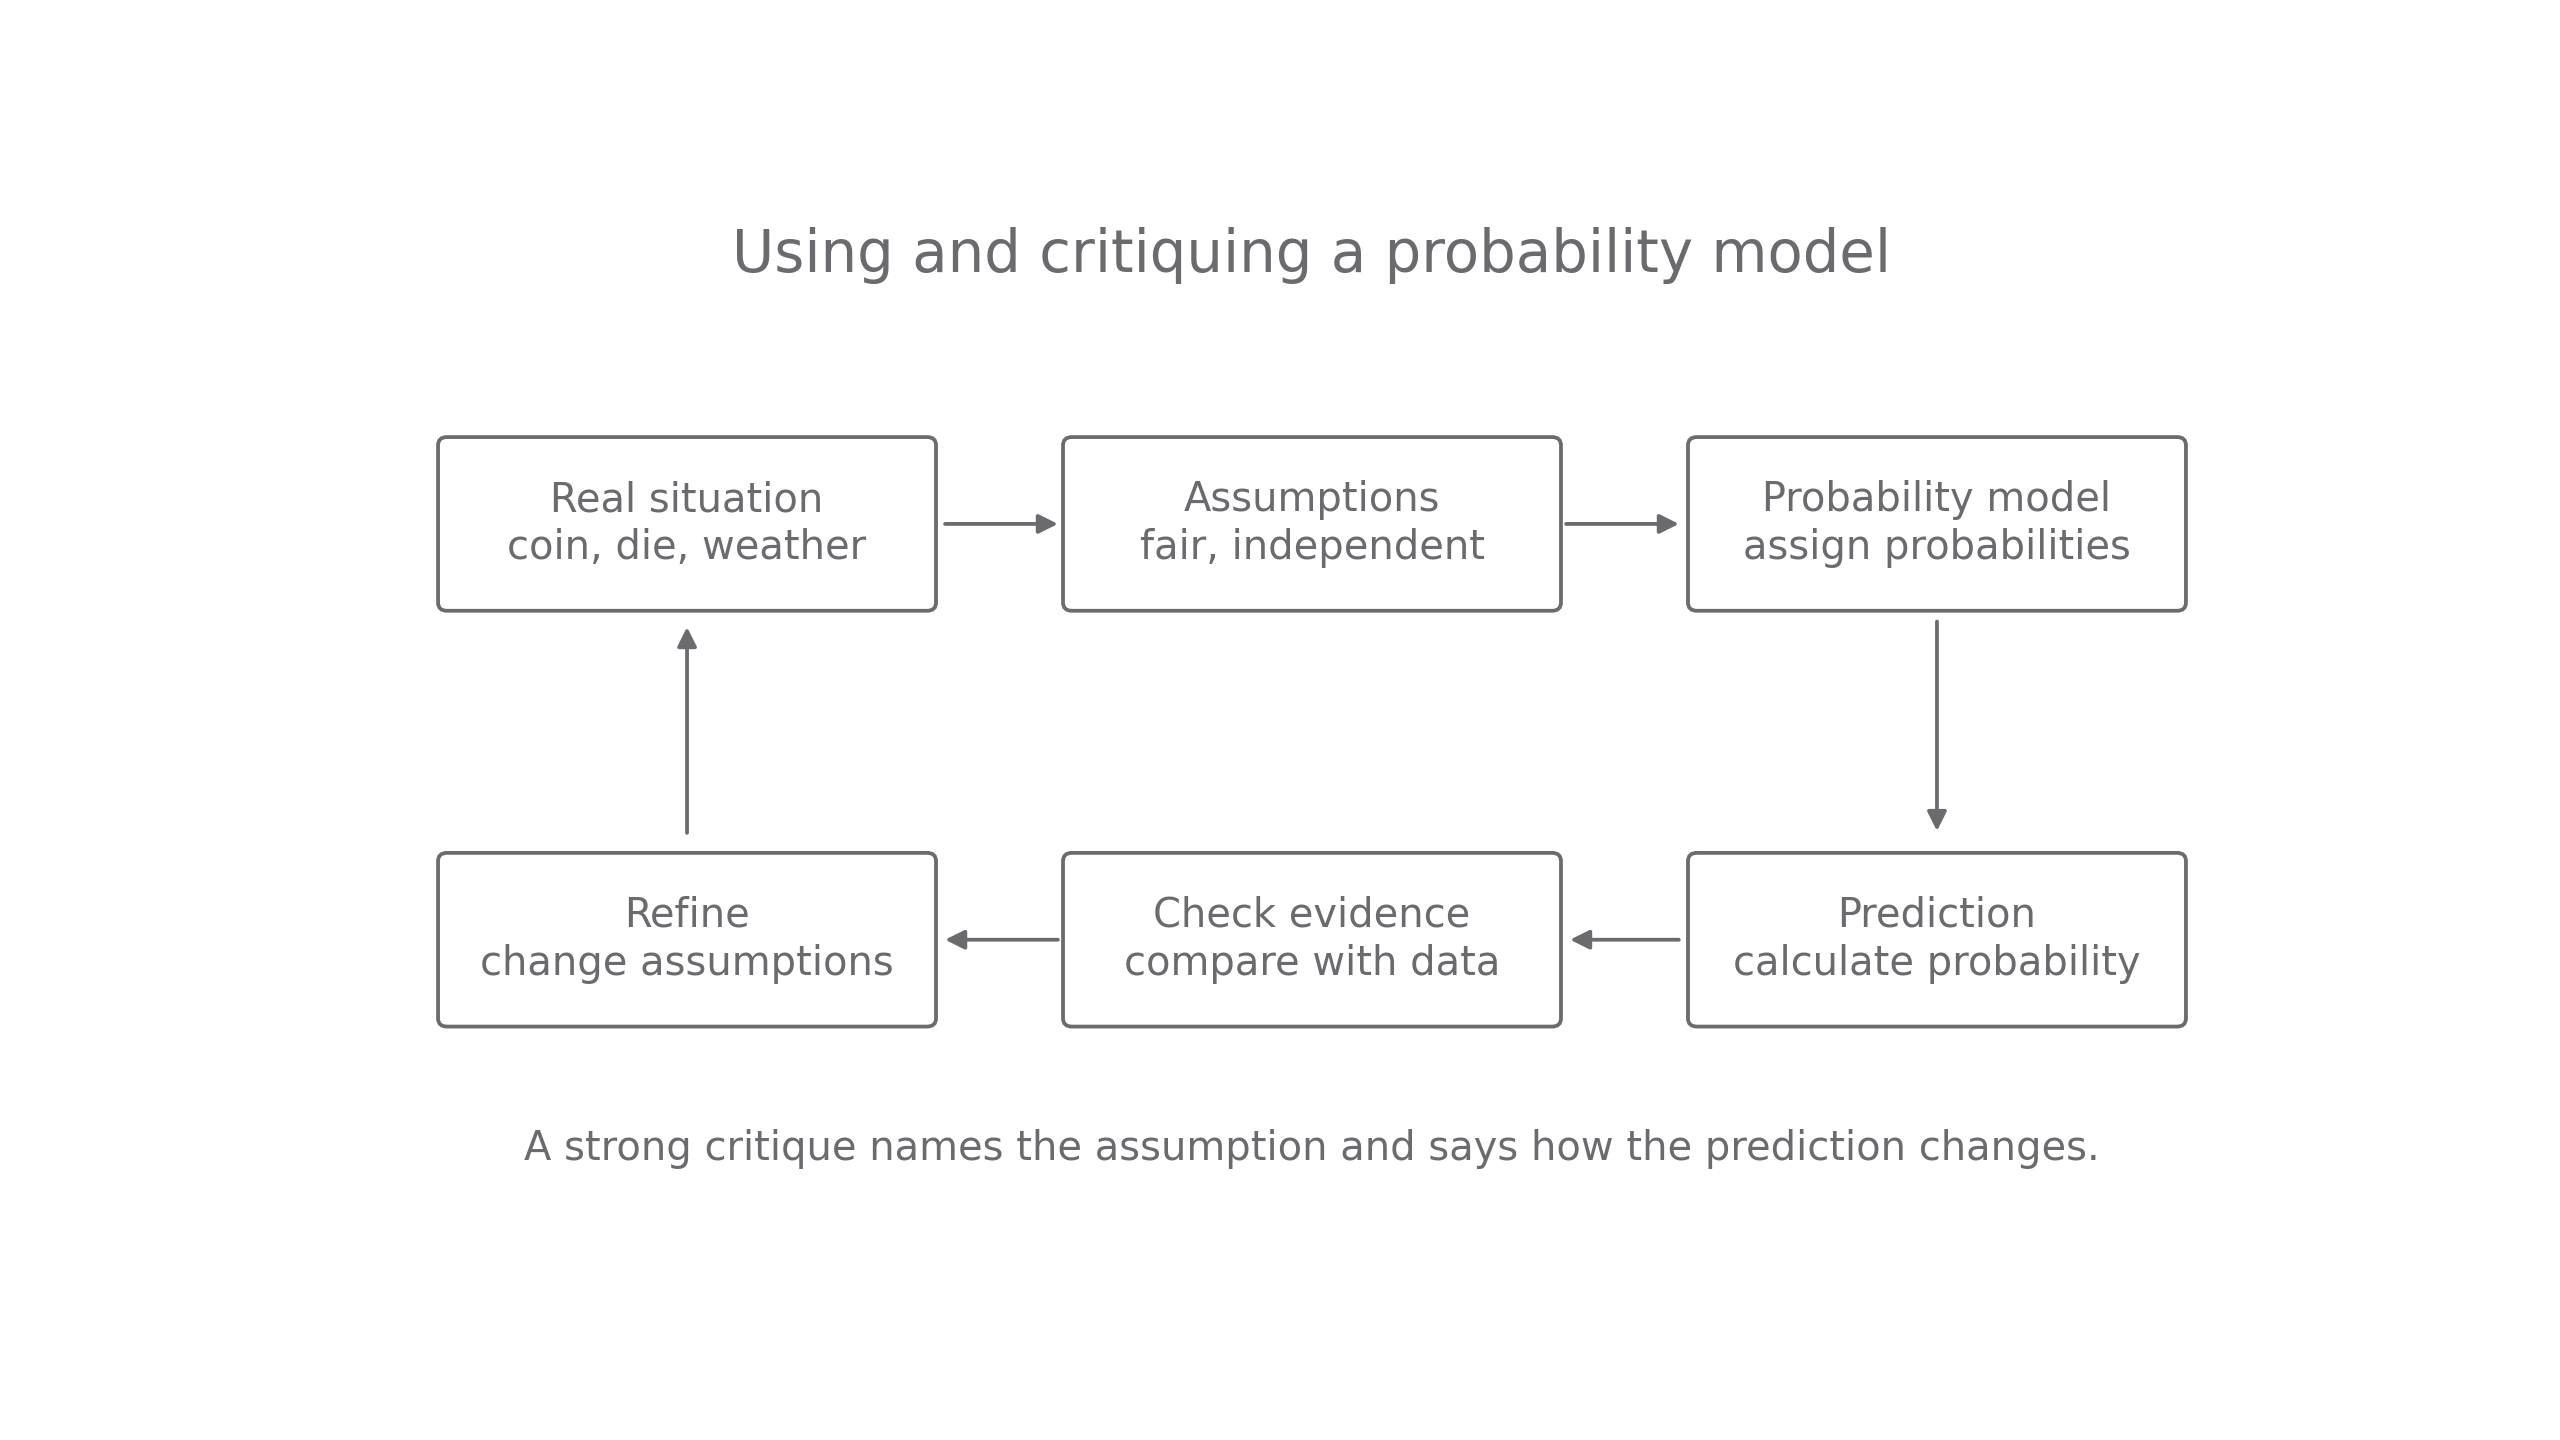
Construct the model, calculate under its assumptions, then judge what the result means.
Worked example 1: a fair independent coin
Question. A coin is tossed four times. Assuming fairness and independence, find the probability of at least three heads.
Plan. Add the four paths containing exactly three heads and the one path containing four.
Why are there four three-head paths? The single tail can occupy any of the four positions.
Answer. The model probability is .
Check. Counting sequences with zero, one or two heads gives , the remaining .
Change only the probability of heads to . Keep the tosses independent, so a path's probability still multiplies.
Worked example 2: changing fairness
Question. With on each of four independent tosses, find the probability of at least three heads and compare with the fair model.
Plan. Weight the same five paths using the revised head and tail probabilities.
Why are the paths no longer all equally likely? They contain different numbers of heads and tails.
Answer. The revised probability is to significant figures, above ; the fair model underestimates this event.
Check. .
A four-sector fair spinner spun independently twice similarly gives . Equal sector probabilities and independence are distinct assumptions used at different steps.
Key idea
Name the assumption that justifies each step: fairness supplies probabilities; independence justifies unchanged probabilities across trials.
Move the heads probability again, keeping all other features fixed.
Fair models and more realistic models
Fairness is convenient, but worn objects or the way they are used can favour some outcomes. A refined model changes the probabilities for a stated reason. It still has to satisfy the probability rules.
[DIAGRAM: asset_slug: p3_3_3_understand_and_model_with_probability_including_critiquing_assumptions__diagram_02; asset_name: Statistics 3.3 - Probability modelling and assumptions - diagram 02; caption: Increasing the six probability changes a two-roll prediction; description: A fair die has six probabilities of one sixth. A loaded model assigns 0.15 to each of faces one to five and 0.25 to six; the corresponding probabilities of two sixes are one thirty-sixth and one sixteenth.]
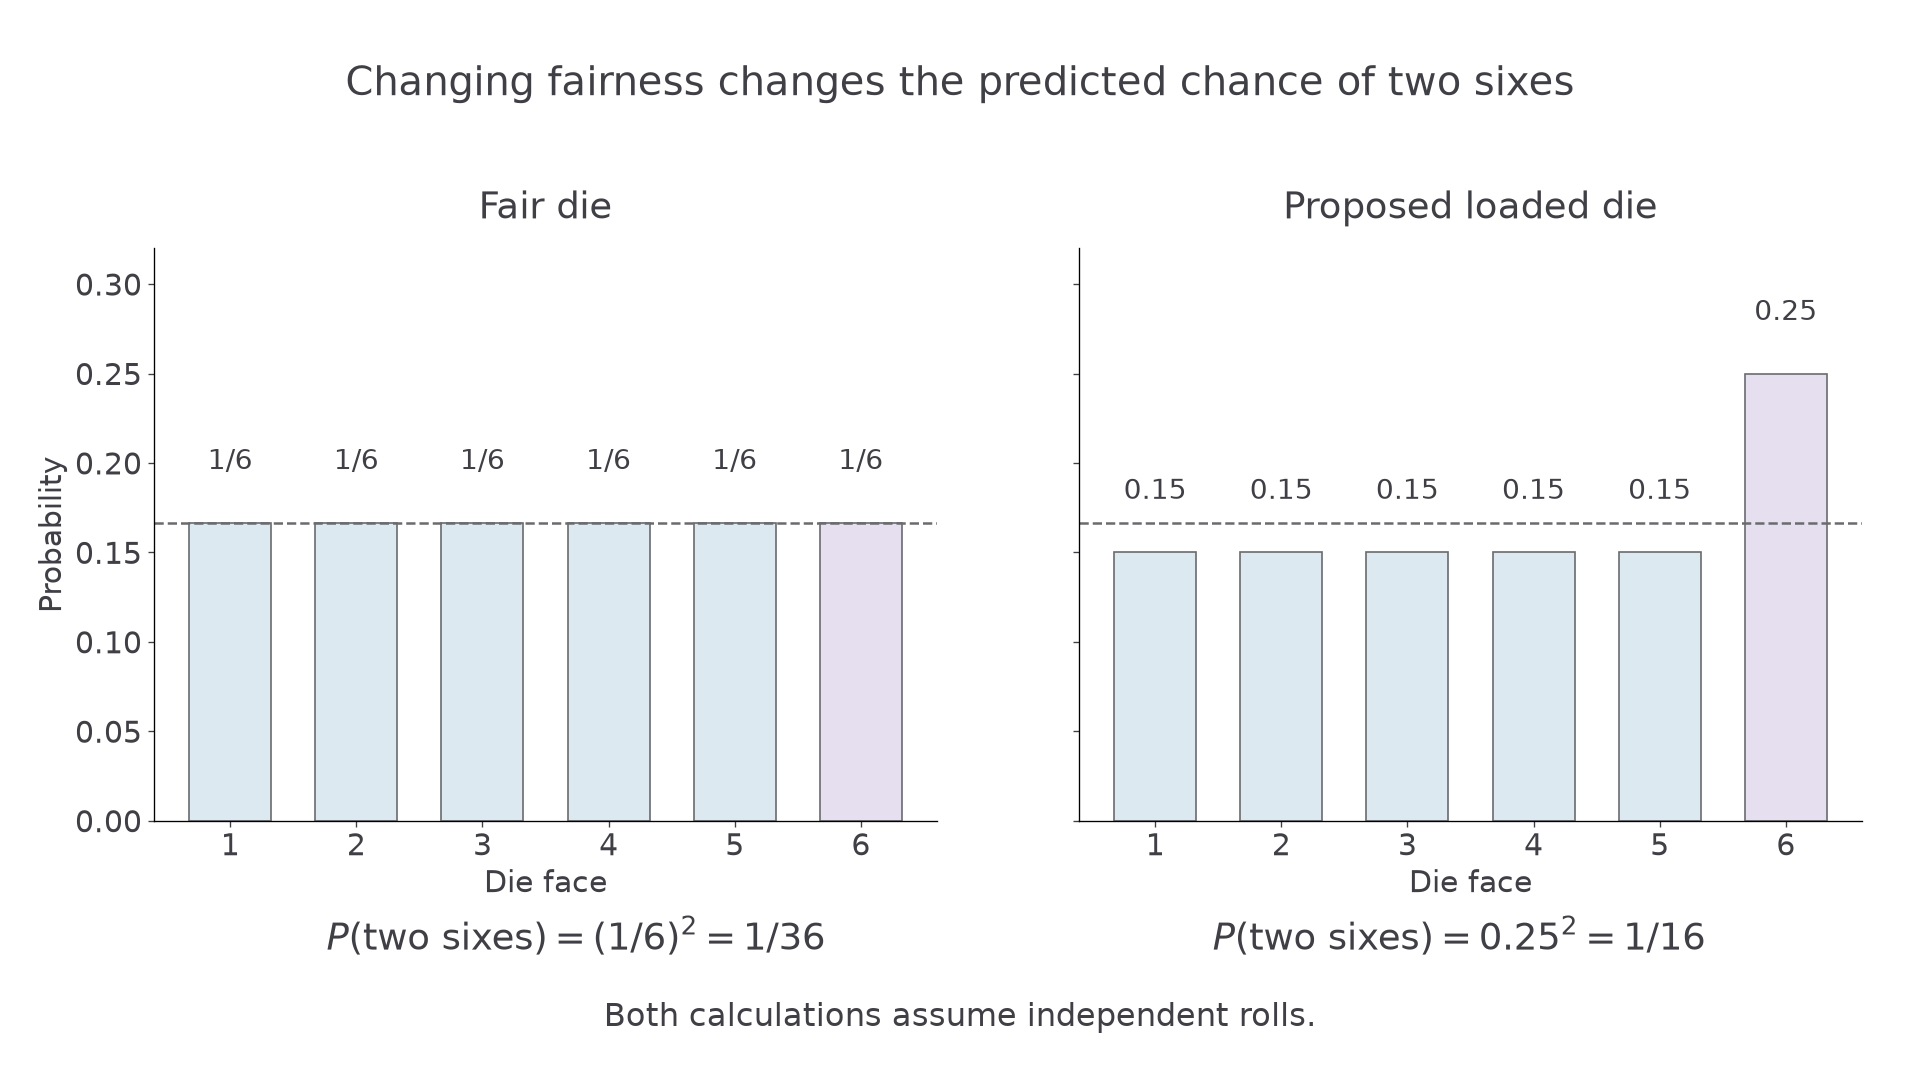
The loaded model is valid because , with all probabilities nonnegative. “More realistic” needs evidence about the particular die; these values describe a proposed model rather than measured data.
Worked example 3: fair-die prediction
Question. A game is won by rolling two sixes in two rolls. Find the win probability assuming a fair die and independent rolls.
Plan. Multiply the two six probabilities.
Why multiply? The rolls are independent and both must be sixes.
Answer. The win probability is to significant figures.
Check. Of the equally likely ordered pairs, only wins.
Change only from to , keeping independent rolls.
Worked example 4: a die favouring sixes
Question. Find the win probability under , and compare with the fair model.
Plan. Use the revised probability in both factors.
Why square the new probability? Both rolls use the same revised die model.
Answer. The probability is , which is times the fair prediction. The fair model underestimates the chance of winning.
Check. The probability of at least one non-six is .
The direction of change depends on the event. Here is a useful surprise: for two independent coin tosses with ,
With this is , but with it is . Favouring heads raises the chance of two heads while lowering the chance of exactly one. Likewise gives two-head probability , above the fair value .
Watch out
“The coin favours heads, so every probability increases” is wrong. Identify the particular event and recalculate its paths.
Change only the proposed six probability once more.
Comparing a model with evidence
Observed data help judge a model, but a mismatch can arise through random variation. Comparing a relative frequency with a model probability is evidence, rather than a proof that the model is false.
Observed relative frequency
For a positive number of observations,
Not in the formula booklet: learn it.
Pearson's weather Large Data Set records daily mean cloud in oktas. At Heathrow in June 2015, the recorded values have these frequencies:
| Cloud cover , in oktas | |||||||||
|---|---|---|---|---|---|---|---|---|---|
| Days |
A proposed uniform model assigns probability to each integer . It is a useful model to question, rather than a claim that all cloud amounts really occur equally often.
Worked example 5: a cloud-cover comparison
Question. Compare the uniform model's probability of with the Heathrow June 2015 relative frequency. Suggest a refinement.
Plan. Count permitted model values and observed days separately.
Why compare proportions rather than the counts and ? They refer to different totals: nine possible model values and thirty observed days.
Answer. The observed proportion is higher. The model underpredicts this event in this sample. Estimate non-uniform probabilities using more historical data from the same station and season, rather than treating one month as conclusive.
Check. The full frequency row sums to ; the low-cloud count is within that total.
Change only the event threshold from to . Keep the same model and actual observations.
Continue this lesson.
You’re previewing NovaLearn without an account. Create a free account to read the rest.
Create free account