Statistics 3.2 - Conditional probability with diagrams and tables
“Given that” changes which outcomes you consider. You will calculate conditional probabilities using event totals, Venn diagrams, trees and two-way tables, then choose a representation that makes the denominator clear.
Given that changes the sample space
A factory uses setting for of its components. Fault rates are with and without it. If a component is faulty, is the chance that was used still ? We will answer this by restricting the sample space.
You already know
means both events, and means not . Individual Venn regions add to the whole event total.
Start with counts: of people, are in and are in both and . Given , only people remain eligible. The proportion also in is .
Conditional probability
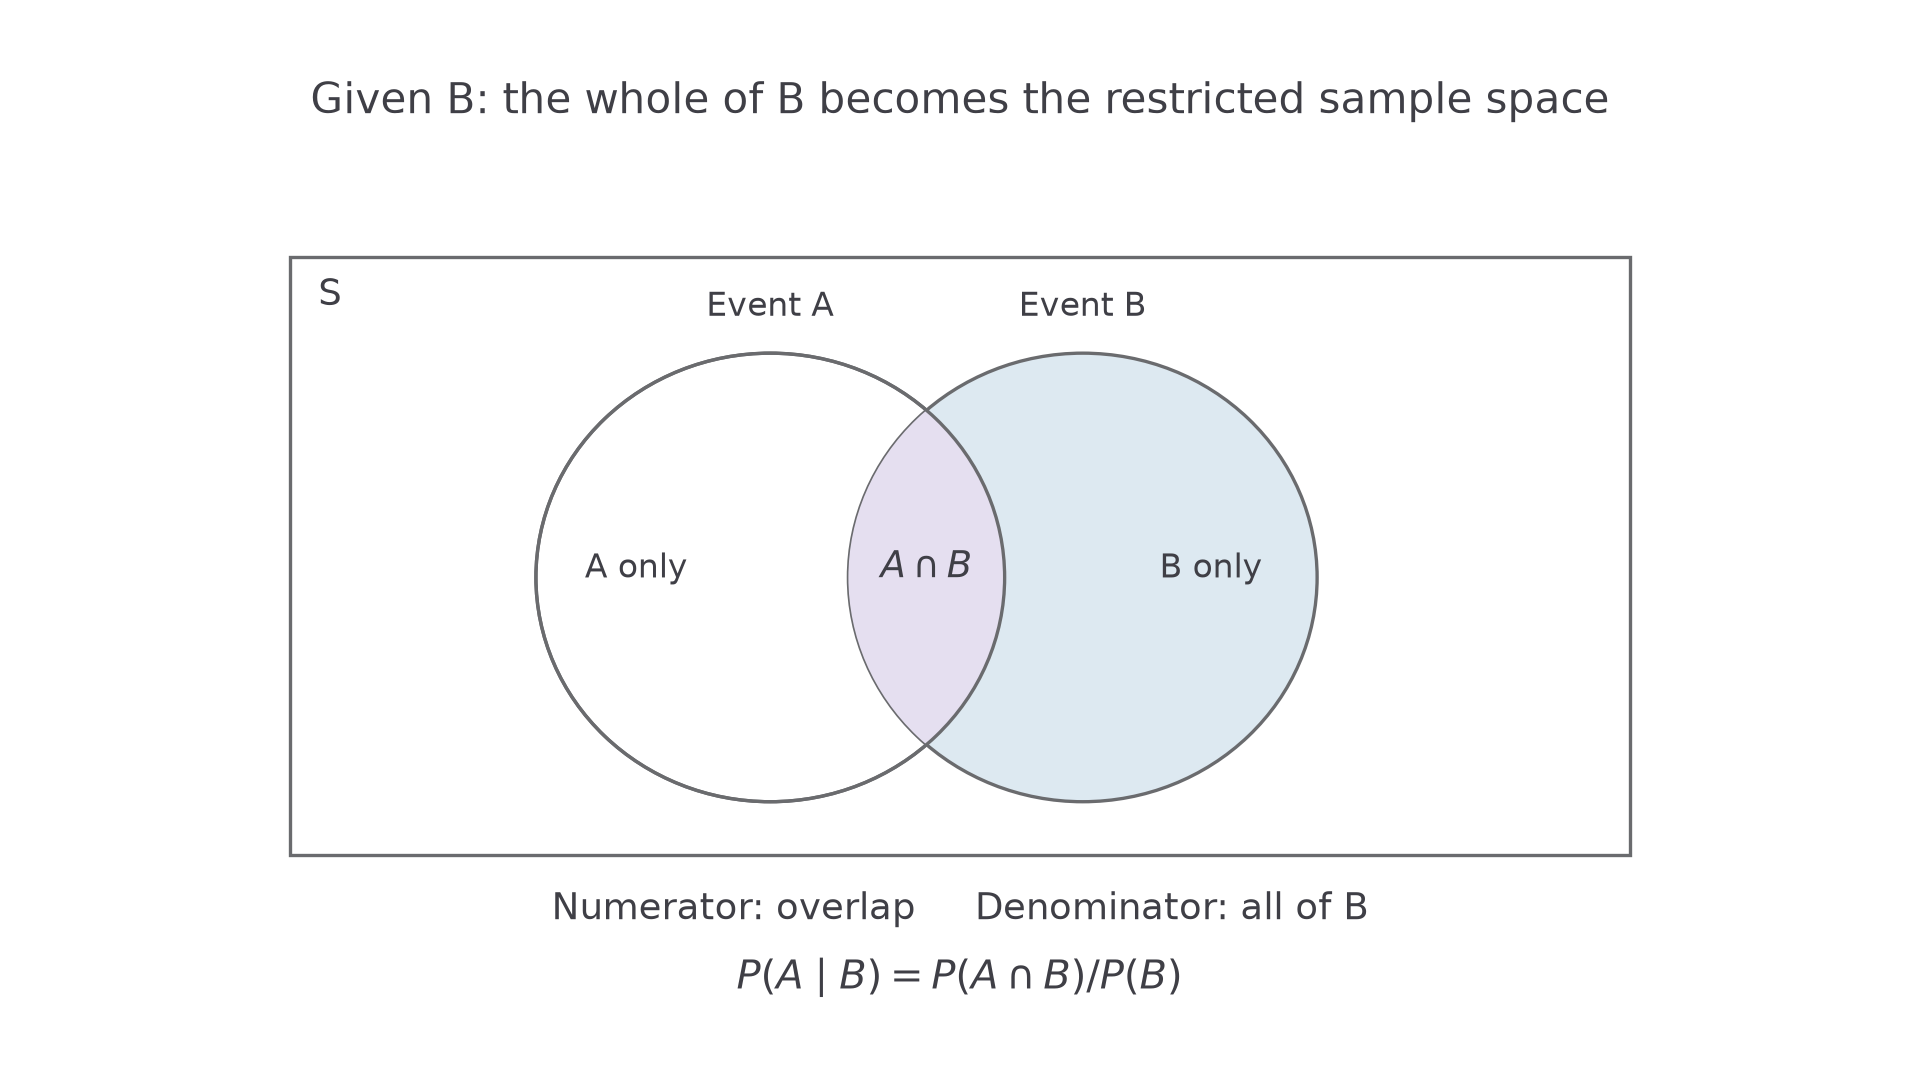
is the probability of given that occurs. It is defined when . The condition after the vertical line restricts the sample space.
Divide the overlap by the whole condition.
Conditional probability
Not in the formula booklet: learn it.
The booklet prints the equivalent intersection-product relation and a two-case expression for reversed conditioning. Learn this direct definition to identify the numerator and denominator.
[DIAGRAM: asset_slug: p3_3_2_understand_and_use_conditional_probability_including_tree_diagrams_venn_diagrams_and_two_way_tables__diagram_01; asset_name: Statistics 3.2 - Conditional probability with diagrams and tables - diagram 01; caption: Restrict to B, then find the fraction also in A; description: A Venn diagram shades B lightly and its intersection with A more strongly; separate labels identify the numerator and denominator.]
Worked example 1: two directions
Question. Given , and , find , and .
Plan. Divide by each condition total, using the remaining part of for the third probability.
Why do the first two answers differ? The overlap is the same, but the restricted groups differ.
Answer. The probabilities are , and .
Check. Within , and partition the possibilities: .
Change only to . Only the question conditioned on needs a new denominator.
Worked example 2: a changed condition total
Question. Given , and , find the same three probabilities.
Plan. Identify the condition separately for each fraction.
Why not change every answer? Neither nor the overlap has changed.
Answer. The probabilities are , and .
Check. The separate regions , , and sum to .
The event after the line matters more than the order in which the data were presented.
Watch out
generally differs from . Read the condition before choosing the denominator.
Change the total again.
Using complements and unions first
Conditional questions may hide the numerator. Find the relevant region first: “neither nor ” is the complement of their union.
Complements, unions and intersections
For events and ,
In the formula booklet.
The product relation follows by rearranging the conditional definition. Independence is unnecessary because the second probability is conditional.
Worked example 3: neither within a complement
Question. Given , and , find .
Plan. Take the complement of the union, then divide by .
Why use the union's complement? The numerator must be outside both events.
Answer. The probability is .
Check. Within , the -only region and the neither region sum to .
Change only to . The denominator stays fixed while the outside-both numerator grows.
Worked example 4: a changed numerator
Question. Given , and , find .
Plan. Recover neither from the union before conditioning.
Why does the answer rise? More of the unchanged group lies outside .
Answer. The probability is .
Check. , and .
Complementing the wanted event keeps the condition fixed.
Watch out
in general. The valid rule is : both fractions condition on .
Find neither within the same condition using a new total.
Reading conditional probability from Venn diagrams
A Venn diagram helps with overlapping sets in one population. Fill the overlap first, subtract it from each event total, then find neither. Counts and probabilities both work, provided numerator and denominator use the same units.
Worked example 5: overlapping student groups
Question. Of students, study music, play sport and do both. Find , and .
Plan. Build the four separate regions, then select each denominator.
Why is the first denominator ? Knowing the student plays sport removes everybody outside that group.
Answer. The probabilities are , and .
Check. The four regions sum to , and the last two probabilities sum to .
Change only the overlap from to , keeping both group totals fixed.
Worked example 6: a changed overlap count
Question. Of students, study music, play sport and do both. Find the same three probabilities.
Plan. Rebuild the regions before forming the fractions.
Why does the union grow? Less of the fixed event totals is counted twice.
Answer. The probabilities are , and .
Check. , with no negative region.
A Venn sketch need not be to scale: use its labels rather than measuring its areas unless an area model is explicitly stated.
Exam tip
The conditional denominator includes every region inside the condition, including the overlap.
Change the overlap count again.
Using tree diagrams for staged events
Use a tree for stages. Each second-stage branch is conditional on the first-stage outcome. Branches need not match, and each set leaving one branch point must sum to .
Continue this lesson.
You’re previewing NovaLearn without an account. Create a free account to read the rest.
Create free account