Pure 6.6 - Logarithmic graphs for estimating parameters
Turn curved positive data into a straight line so you can estimate a model's constants. You will choose the correct logarithmic axes for power and exponential relationships, recover parameters from a gradient and intercept, and judge how far a fitted model can be trusted.
Why logarithmic graphs make parameters visible
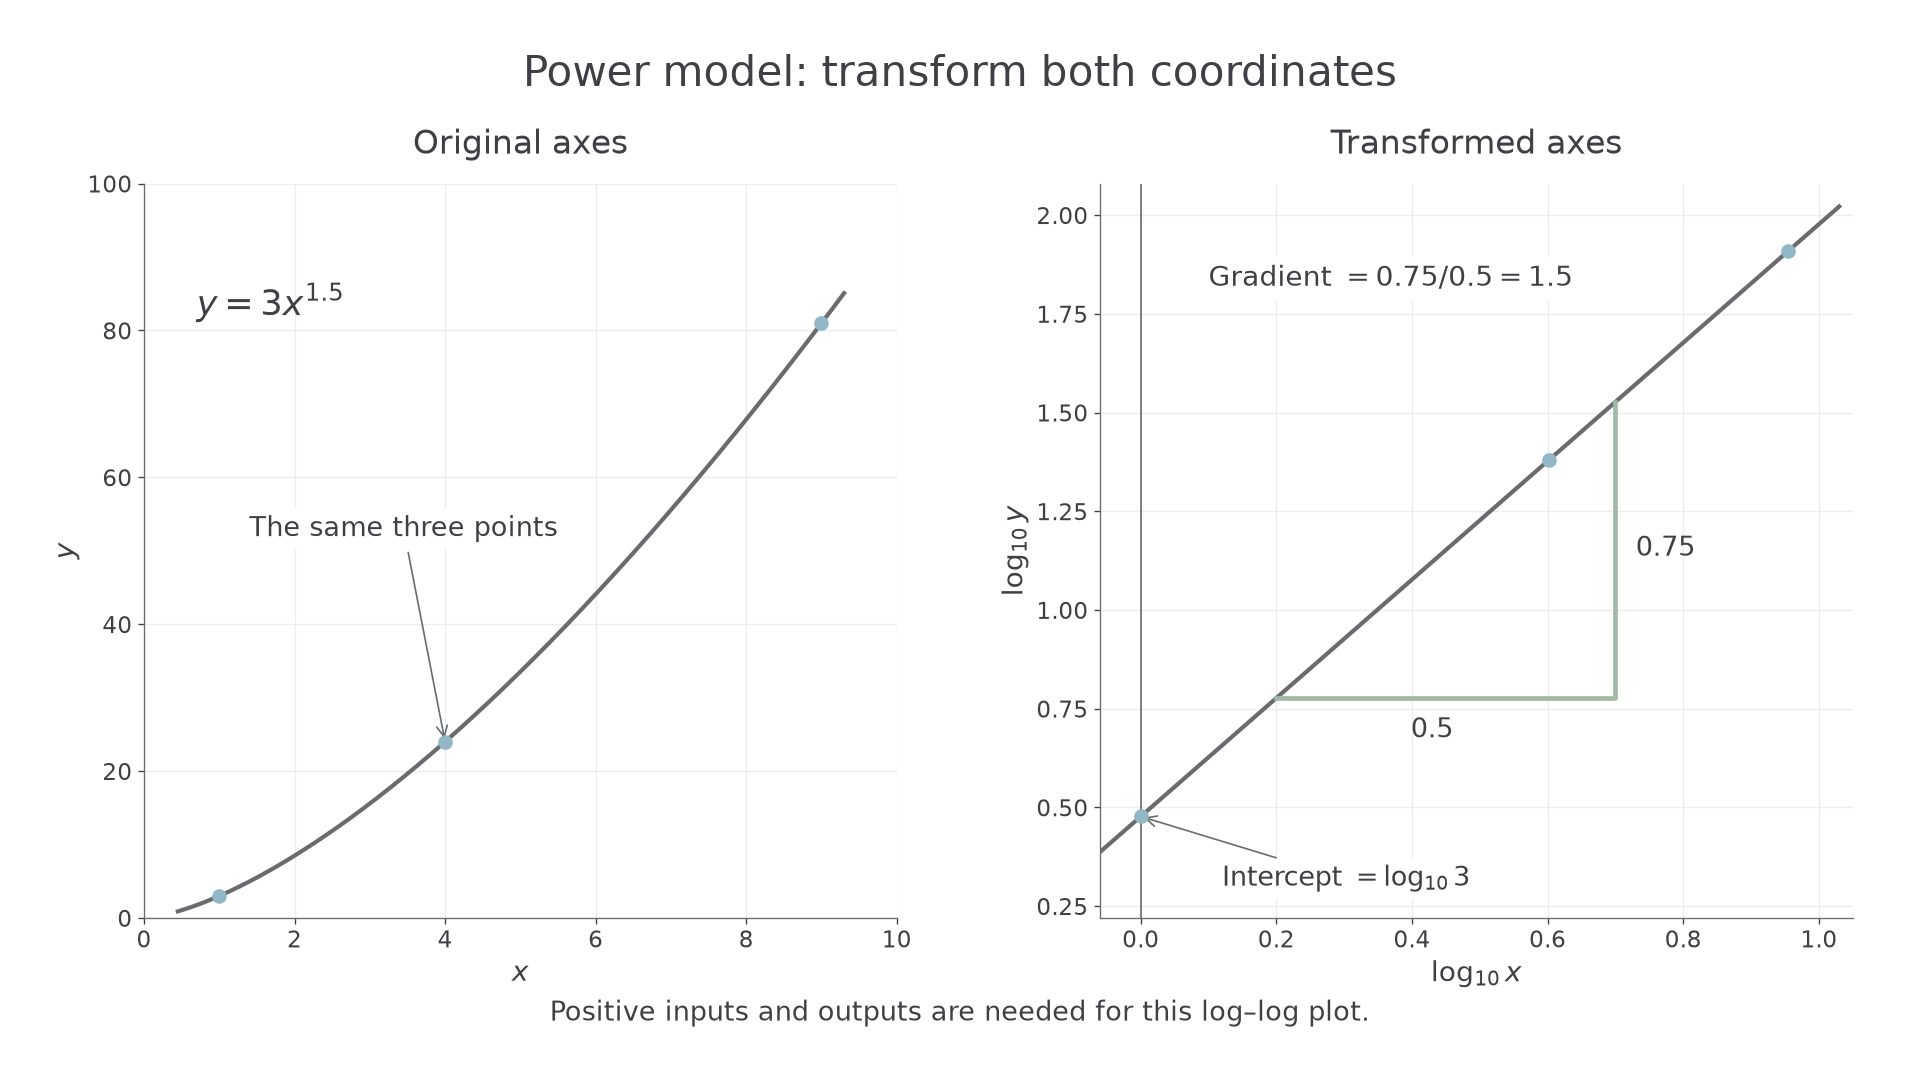
Can the curved data , , hide a straight line? They fit . Taking base- logarithms gives coordinates approximately , , , which lie on one line. The curve has become a way to read two constants with a ruler.
You already know
A straight line has form . For positive inputs, logarithms turn products into sums and powers into multipliers: and .
We change the variables on the axes, rather than pretending the original curve is straight. The capital letters below are names for those transformed variables.
Linearisation
Linearisation transforms a relationship into the form . For example, plotting against makes a positive power relationship straight. Plotting the original against does not generally do so.
Here, “plot against ” means put vertically and horizontally. The required transformation depends on where the variable appears in the model.
| Model | Vertical variable | Horizontal variable | Gradient | Vertical intercept |
|---|---|---|---|---|
Any value being logged must be positive. Thus both graphs need ; the power-model graph also needs . In an exponential-model graph, or a negative is allowed because we do not log . Use one logarithm base throughout; we write base explicitly for numerical graphs.
Key idea
A power model logs both variables. An exponential model logs the output but leaves the input unchanged.
The axis choice is a mathematical decision. Check it before interpreting any slope.
Estimate parameters in a power model
For , taking logs gives . You can see the gradient before calculating a single point. The same algebra works for any positive coefficient and real power on .
Linear form of a power model
For , with and ,
Plot against : gradient , intercept . Use the same logarithm base in both variables.
Not in the formula booklet: learn it.
The derivation uses the log laws: . These log laws are recall knowledge; the straight-line model is not supplied in the booklet.
[DIAGRAM: asset_name: A power curve becomes a straight line; asset_slug: p1_6_6_use_logarithmic_graphs_to_estimate_parameters_in_relationships_of_the_form_y_ax_n_and_y_k_b_x__diagram_01; caption: Logging both coordinates turns the power curve into a line whose gradient is the power; description: Two panels show y=3x to the power 1.5 on ordinary axes and log base 10 of y against log base 10 of x. Corresponding points are marked. The transformed intercept is log base 10 of 3, and a clear rise/run triangle shows gradient 1.5.]
Worked example 1: read a base-ten power model
Question. A plot of against has gradient and intercept . Estimate the model .
Plan. Read directly from the gradient and undo the logarithm of .
Why this step? The intercept is , so writing would leave the transformation undone.
Answer. .
Check. At , and , consistent with the intercept. At , the model gives approximately .
Worked example 2 changes only the logarithm base used for the same relationship. The intercept changes, but the recovered model does not.
Worked example 2: read a natural-log power model
Question. A plot of against has gradient and intercept . Estimate in .
Plan. Keep the gradient as the power and use to undo a natural logarithm.
Why this step? An axis labelled needs , whereas an axis labelled needs .
Answer. , , so .
Check. , consistent with the rounded intercept. Both examples recover the same model.
This is a useful mathematical surprise: changing the log base stretches both axes by the same factor, so the gradient of a power-model graph stays unchanged. Negative gradients are allowed too; they describe negative powers, with decreasing as positive increases.
Watch out
Wrong: the power-model intercept gives when . Right: it occurs at , which means . The coefficient is the value there; is undefined.
In the next model the gradient is negative. Recover the coefficient using the stated log base exactly as before.
Estimate parameters in an exponential model
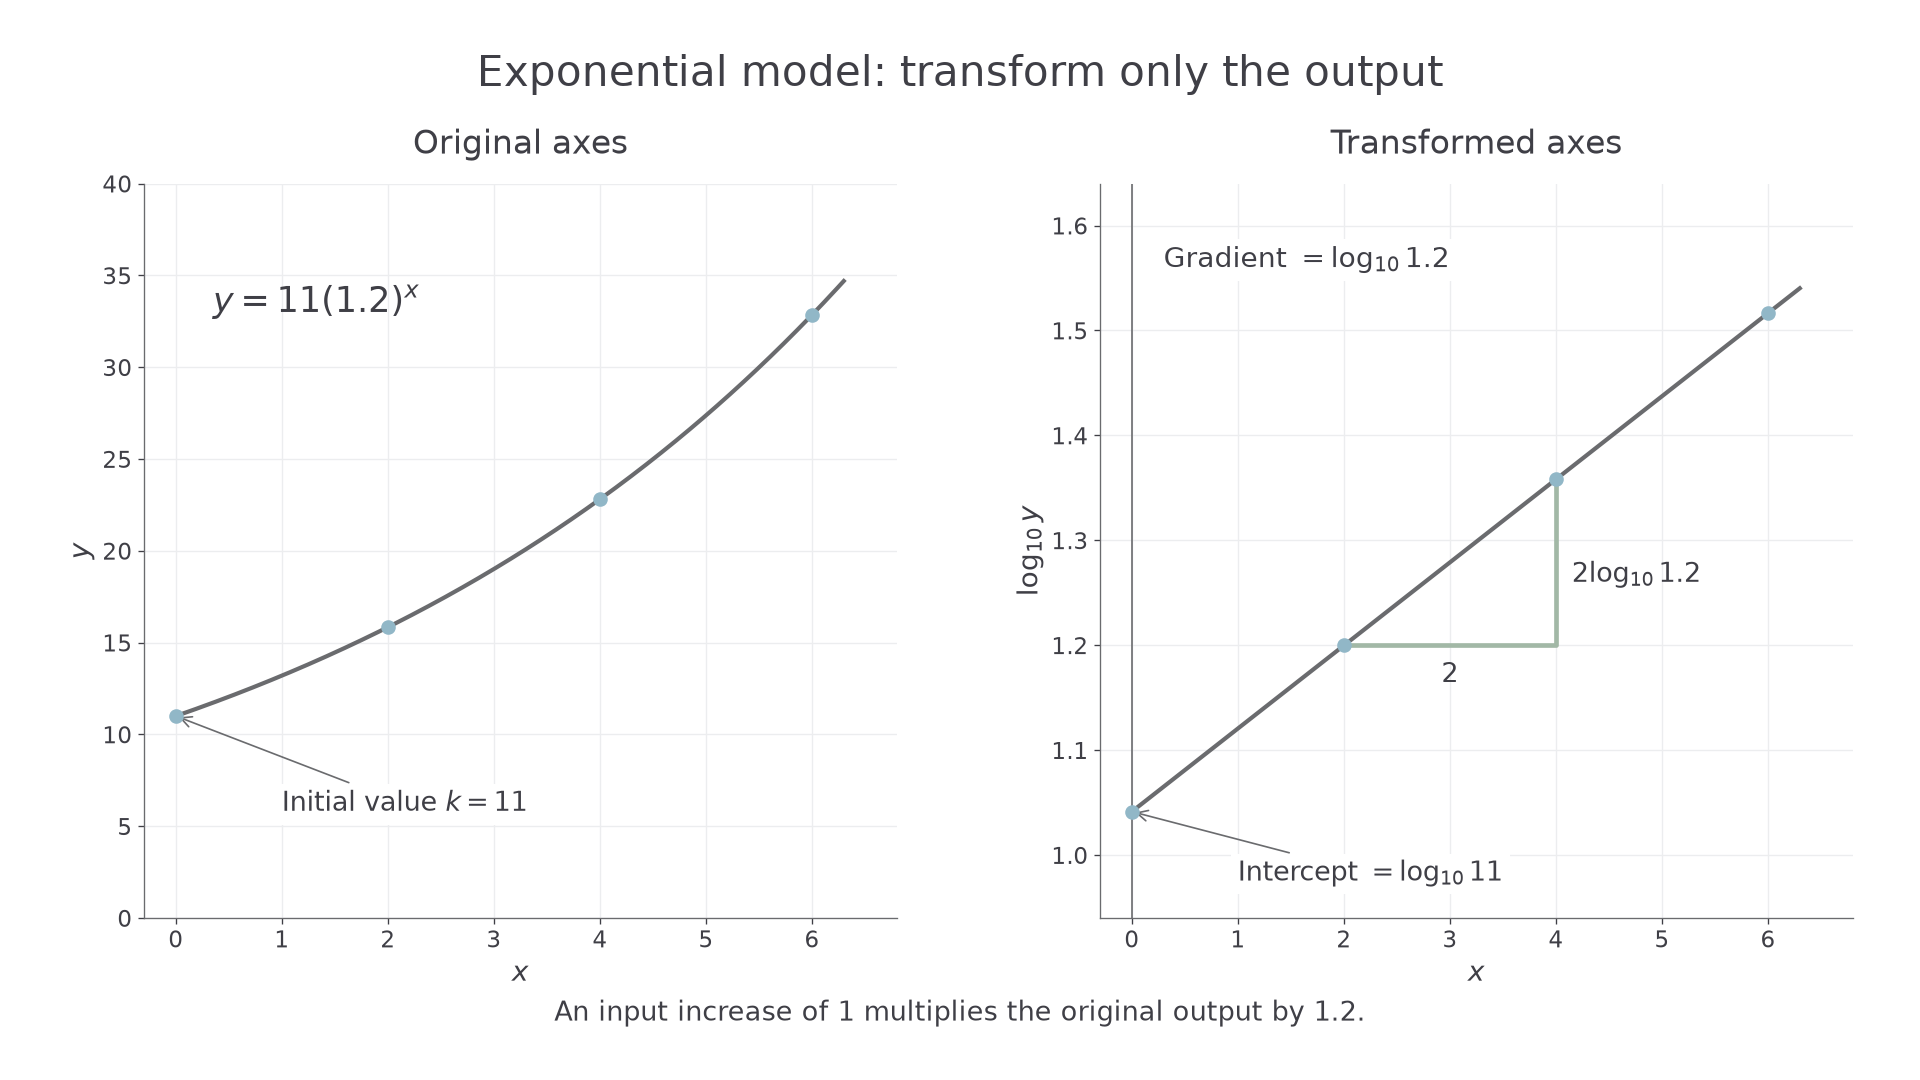
For , each increase of in multiplies by . Logging the output turns that repeated multiplier into equal additions on the vertical axis.
Linear form of an exponential model
For , with and ,
Plot against : gradient , intercept . For a changing exponential model, ; gives a horizontal line.
Not in the formula booklet: learn it.
The derivation is . The variable is already a multiplier, so it stays untransformed.
[DIAGRAM: asset_name: An exponential curve becomes a straight line; asset_slug: p1_6_6_use_logarithmic_graphs_to_estimate_parameters_in_relationships_of_the_form_y_ax_n_and_y_k_b_x__diagram_02; caption: Logging only the output gives a straight line with gradient equal to the logarithm of the multiplier; description: Two panels show y=11 times 1.2 to the x and log base 10 of y against x. The original initial value is 11. The transformed intercept is log base 10 of 11, and a rise/run triangle identifies the gradient log base 10 of 1.2.]
Worked example 3: recover both exponential constants
Question. A plot of against has intercept and gradient . Estimate in , to significant figures.
Plan. Take base- antilogs of both the intercept and gradient.
Why this step? Unlike a power-model slope, this slope is a logarithm of the parameter. Both constants need an antilog.
Answer. , , giving .
Check. At , . Increasing by multiplies by approximately , a increase per input unit.
Continue this lesson.
You’re previewing NovaLearn without an account. Create a free account to read the rest.
Create free account