S2 1.1, S2 1.2 - The binomial distribution
A fixed number of independent attempts produces a count of successes. Learn when the binomial model fits, calculate individual and cumulative probabilities, and use its mean and variance to work backwards to the model's parameters.
Binomial assumptions and model choice
If a player succeeds on three quarters of their attempts, should you expect exactly six successes in eight attempts? Six is a useful average, but the count can vary. A distribution describes that variation.
Imagine eight attempts, each independently successful with probability . Record each attempt as success or failure, then let count successes. The possible values are , rather than every real number between zero and eight.
Binomial distribution
Write when counts successes in a fixed number of independent trials, each having two categories, success and failure, with the same success probability . Its possible values are the integers from to .
“Success” names the category counted; it need not be desirable. For example, a defect can be a success in a count of defective components. A trial may have many physical outcomes, provided each is classified into one of two categories: a die throw is either a six or not a six.
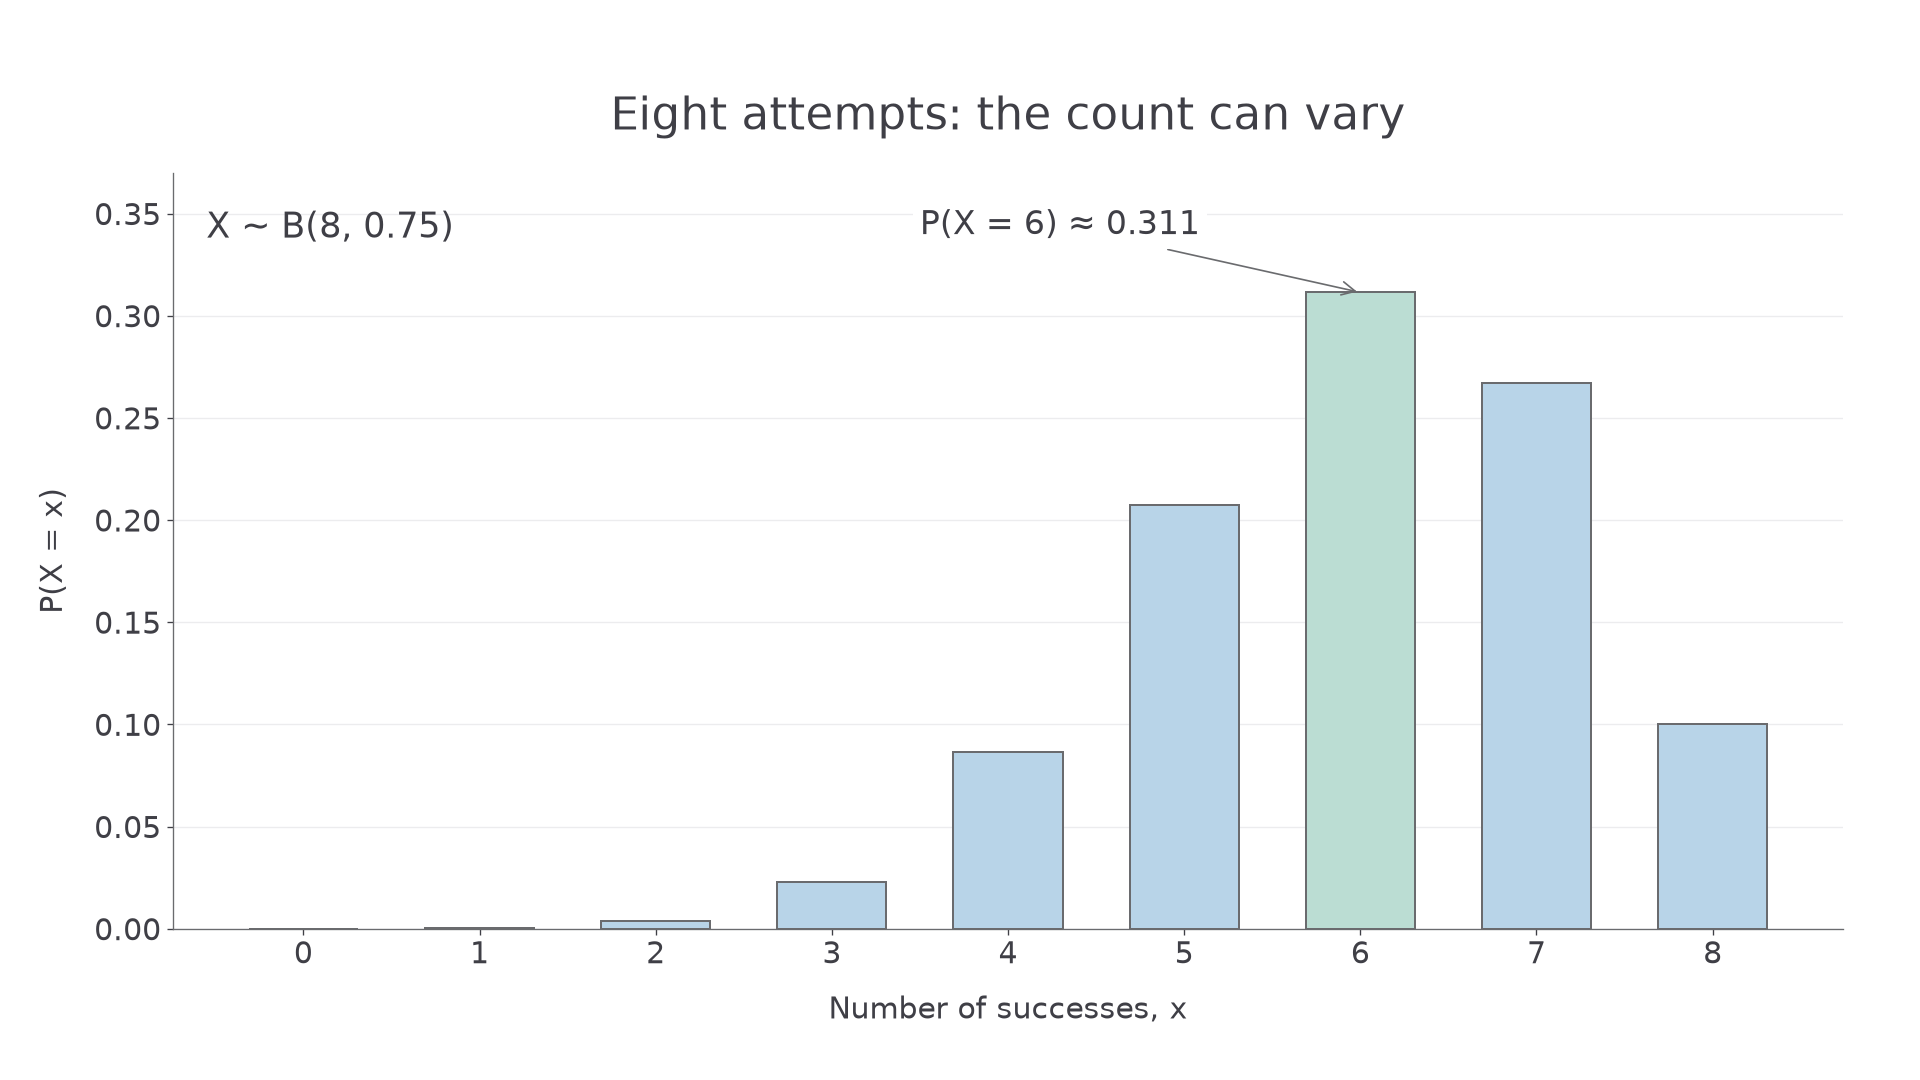
For the eight attempts, . The picture shows that six is most likely, yet several nearby counts have substantial probability.
[DIAGRAM: asset_name: A binomial success count; asset_slug: s2-binomial-count; caption: Eight independent attempts with success probability 0.75 give a distribution of counts.; description: Bar chart of the binomial distribution with n equal to 8 and p equal to 0.75. Integer counts 0 to 8 are labelled. The bar at 6 has probability approximately 0.311 and is highlighted.]
Consider a different procedure: keep throwing a die until the first six, and count throws. The success probability is constant, but the number of trials is not fixed. This count is not binomial. Checking only one assumption is insufficient.
Key idea
Identify the count, the trial, the fixed number of trials and the success category before writing and .
Apply that checklist to a new count.
Point and cumulative probabilities
A point probability selects one possible count; a cumulative probability adds all counts up to a boundary.
For three successes among ten trials, any particular ordering has probability . There are possible choices of the three successful positions, so multiply by that number. This is the same coefficient that appears in a binomial expansion.
Binomial point probability
If , then
In the formula booklet. The binomial tables give , including the endpoint.
For integer counts, “at least three” is the complement of zero, one or two. Thus . Likewise, “more than three” uses . Write the count boundaries before using your calculator or tables.
Worked example 1: one count
For , find .
Plan. Choose the three successes, then multiply their probability by that of the seven failures.
Answer. , to four decimal places.
Check. The cumulative table gives , agreeing after rounding.
Keep the model unchanged and change just the event, from a single count to an inclusive interval.
Worked example 2: an interval of counts
For the same , find .
Plan. Include counts up to four, then remove counts zero and one.
Answer. , using the supplied table precision.
Check. Adding the three point probabilities gives .
If and you want to use the booklet tables, count failures instead: . For example, out of ten means . The event must change with the variable. Direct calculation is also valid.
Watch out
For , subtract , not . The latter removes the required count two.
Use fresh parameters and retain both endpoints.
Continue this lesson.
You’re previewing NovaLearn without an account. Create a free account to read the rest.
Create free account