P1 1.12 - Moving and stretching graphs
Move, stretch and reflect a graph by following its coordinates. Use the same four transformations on familiar curves and on a graph whose equation you do not know, keeping track of intercepts, turning points and asymptotes.
Vertical translations and stretches
A curve has a minimum at . Does adding move that minimum to or ? The answer depends on where the change appears in the equation.
The notation means the output of a function at input . If , then : the input stays , and the output increases by . A change outside acts on the vertical coordinate.
Vertical transformations
A translation moves every point by the same displacement. A stretch parallel to the -axis multiplies every vertical distance from the -axis by the same positive scale factor.
For , includes a reflection in the -axis as well as the scale factor . In particular, is that reflection alone.
For , a vertical stretch brings points closer to the -axis. If , the expression gives at the inputs where is defined; it is a collapse, rather than an invertible stretch.
Worked example 1: add to the output
Question. Sketch , describing its relationship to .
Plan. Keep each input fixed and add to its output.
All points move upwards by , so draw the same upward-opening shape through these points.
Answer. A translation by ; vertex , -intercept , no -intercepts.
Check. Since , every value of is at least , agreeing with the new minimum.
Change only the operation on the output: multiply it by instead of adding . The vertex now stays on the axis.
Worked example 2: multiply the output
Question. Sketch , describing its relationship to .
Plan. Double each vertical coordinate and leave each horizontal coordinate unchanged.
The curve passes through the same origin but is steeper away from it.
Answer. A stretch parallel to the -axis with scale factor ; vertex and only intercept .
Check. At , the original height is ; the new equation gives , twice the height.
[DIAGRAM: asset_name: Add or multiply the output; asset_slug: vertical-changes; caption: Adding two moves the whole parabola; multiplying by two fixes its zero.; description: Side-by-side labelled axes compare y equals x squared in grey with y equals x squared plus two in blue, and y equals two x squared in blue. Vertices and the points at x equals one are marked.]
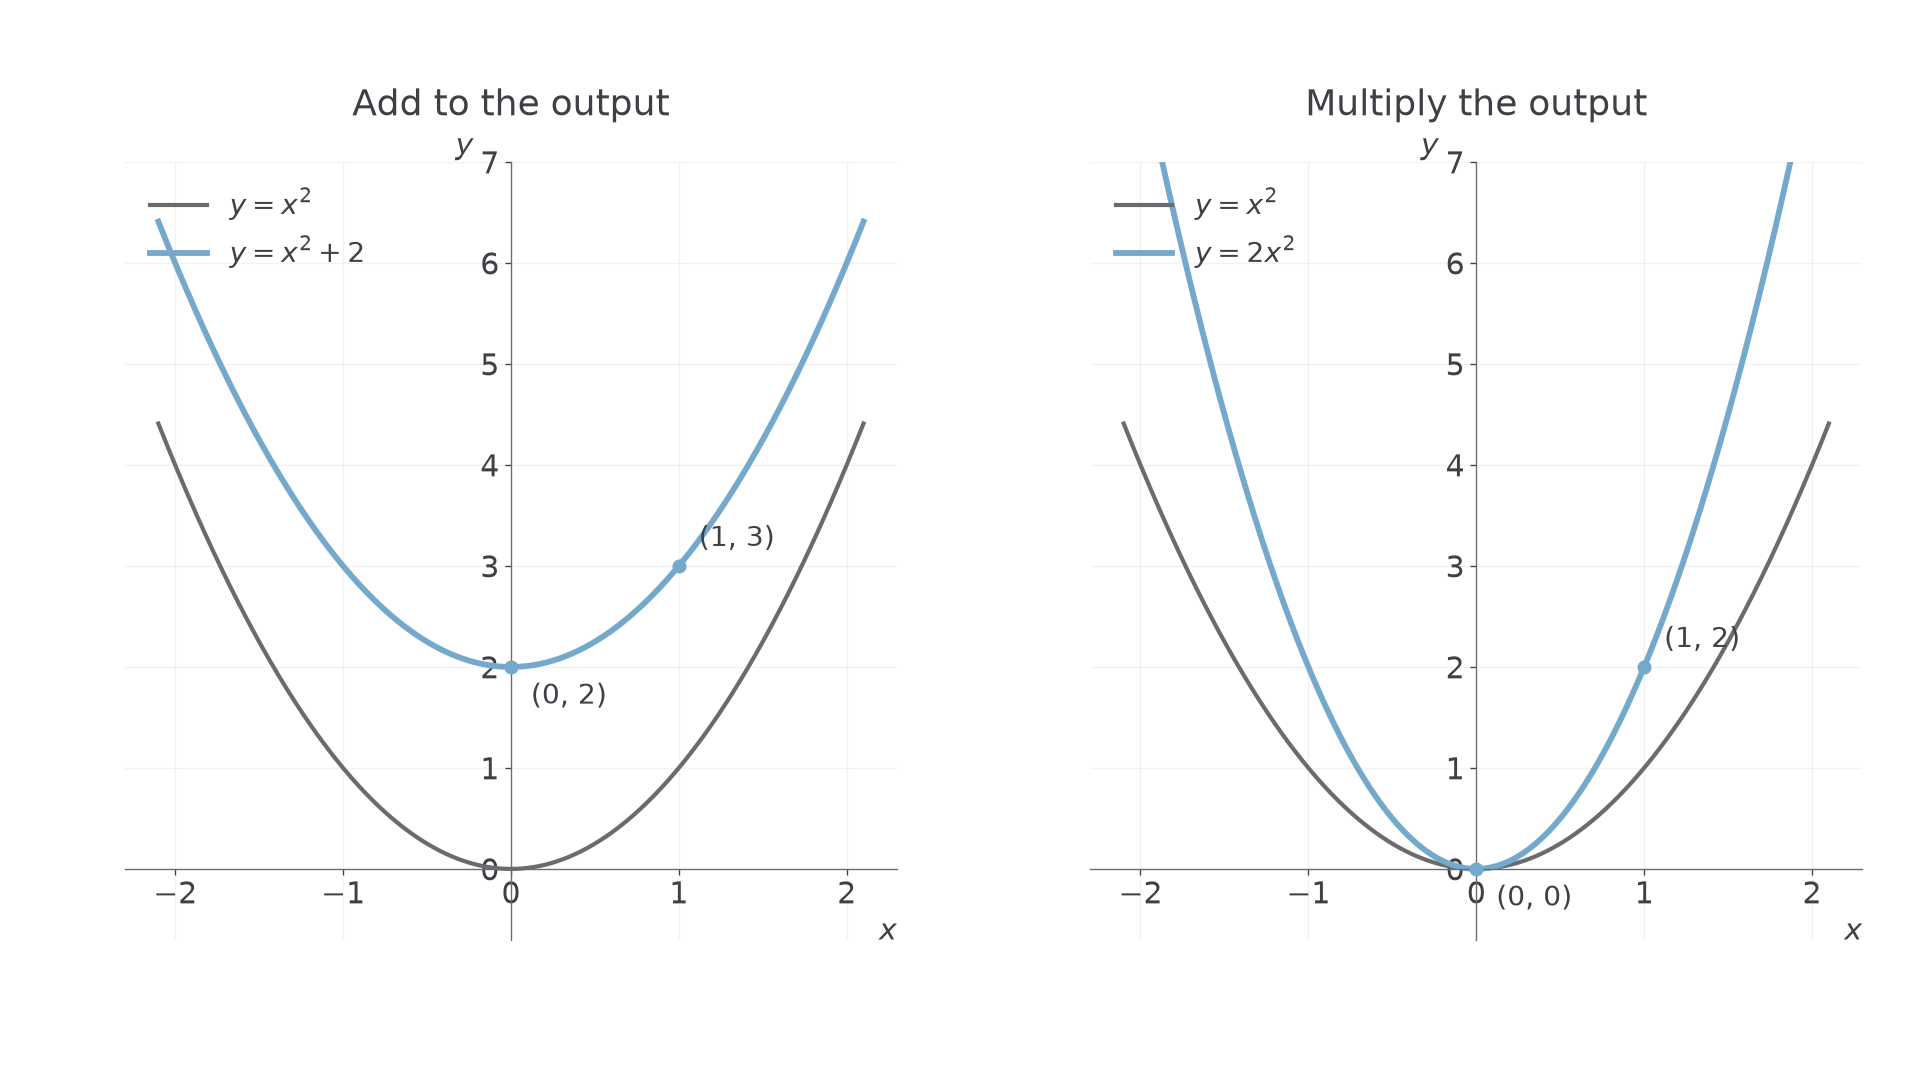
A reflection follows the same coordinate rule: on becomes on .
Horizontal translations and stretches
A change inside the brackets changes which input gives a familiar output, so horizontal movements need a little equation first.
Suppose is on . To get output from , its input must equal : , so . The point moves left by . To get the same output from , solve , giving .
Horizontal transformations
Thus translates by , while has horizontal scale factor , together with a reflection in the -axis if .
In particular, reflects the graph in the -axis. With , is constant if exists; division by is then unavailable.
Worked example 3: add to the input
Question. Given , sketch .
Plan. Solve for each useful original input .
Join these with the increasing cubic shape; its flat crossing moves to .
Answer. , a translation two units left; -intercept and -intercept .
Check. At the new crossing, . At , the equation gives .
Change only the operation inside : multiply the input by instead of adding . We now divide horizontal coordinates by .
Worked example 4: multiply the input
Question. Given , sketch .
Plan. Find the input giving each old output by solving .
The increasing cubic shape is compressed horizontally towards the -axis.
Answer. A stretch parallel to the -axis with scale factor ; the equation is .
Check. Substituting gives , as the mapped point requires.
The same cubic can be obtained by a vertical scale factor ; the requested expression describes its horizontal transformation.
Watch out
The input multiplier and horizontal scale factor are reciprocals. In , a feature at moves to , not .
Use the input equation to avoid guessing the direction.
Mapping points and asymptotes
An asymptote moves with the graph just as a line of marked points would move.
For , the graph approaches the vertical line and horizontal line . After a vertical translation by , values that approached approach . The vertical restriction stays the same. Map characteristic points too: this fixes which side of each asymptote contains the branches.
Worked example 5: move a reciprocal vertically
Question. Sketch , showing its asymptotes and intercepts.
Plan. Translate upwards by , then find where the new output is zero.
The points and become and . Draw both branches approaching their asymptotes.
Answer. Asymptotes , ; -intercept ; no -intercept because is excluded.
Check. At , ; for large , is close to .
Keep the reciprocal and the displacement , but change the direction from vertical to horizontal.
Worked example 6: move a reciprocal horizontally
Question. Sketch , showing its asymptotes and intercepts.
Plan. Translate every feature of three units left.
At , . The numerator never vanishes, so there is no -intercept.
Answer. Asymptotes , ; -intercept ; no -intercept.
Check. As approaches from the right, is small and positive, so the right branch rises without bound.
A reflected reciprocal square supplies another useful shape: is below the -axis on both sides of , with asymptotes and . Multiplying heights has not moved these zero-coordinate lines.
Single transformations of unfamiliar graphs
You can transform a graph without knowing its equation: its plotted coordinates already tell you what the function does.
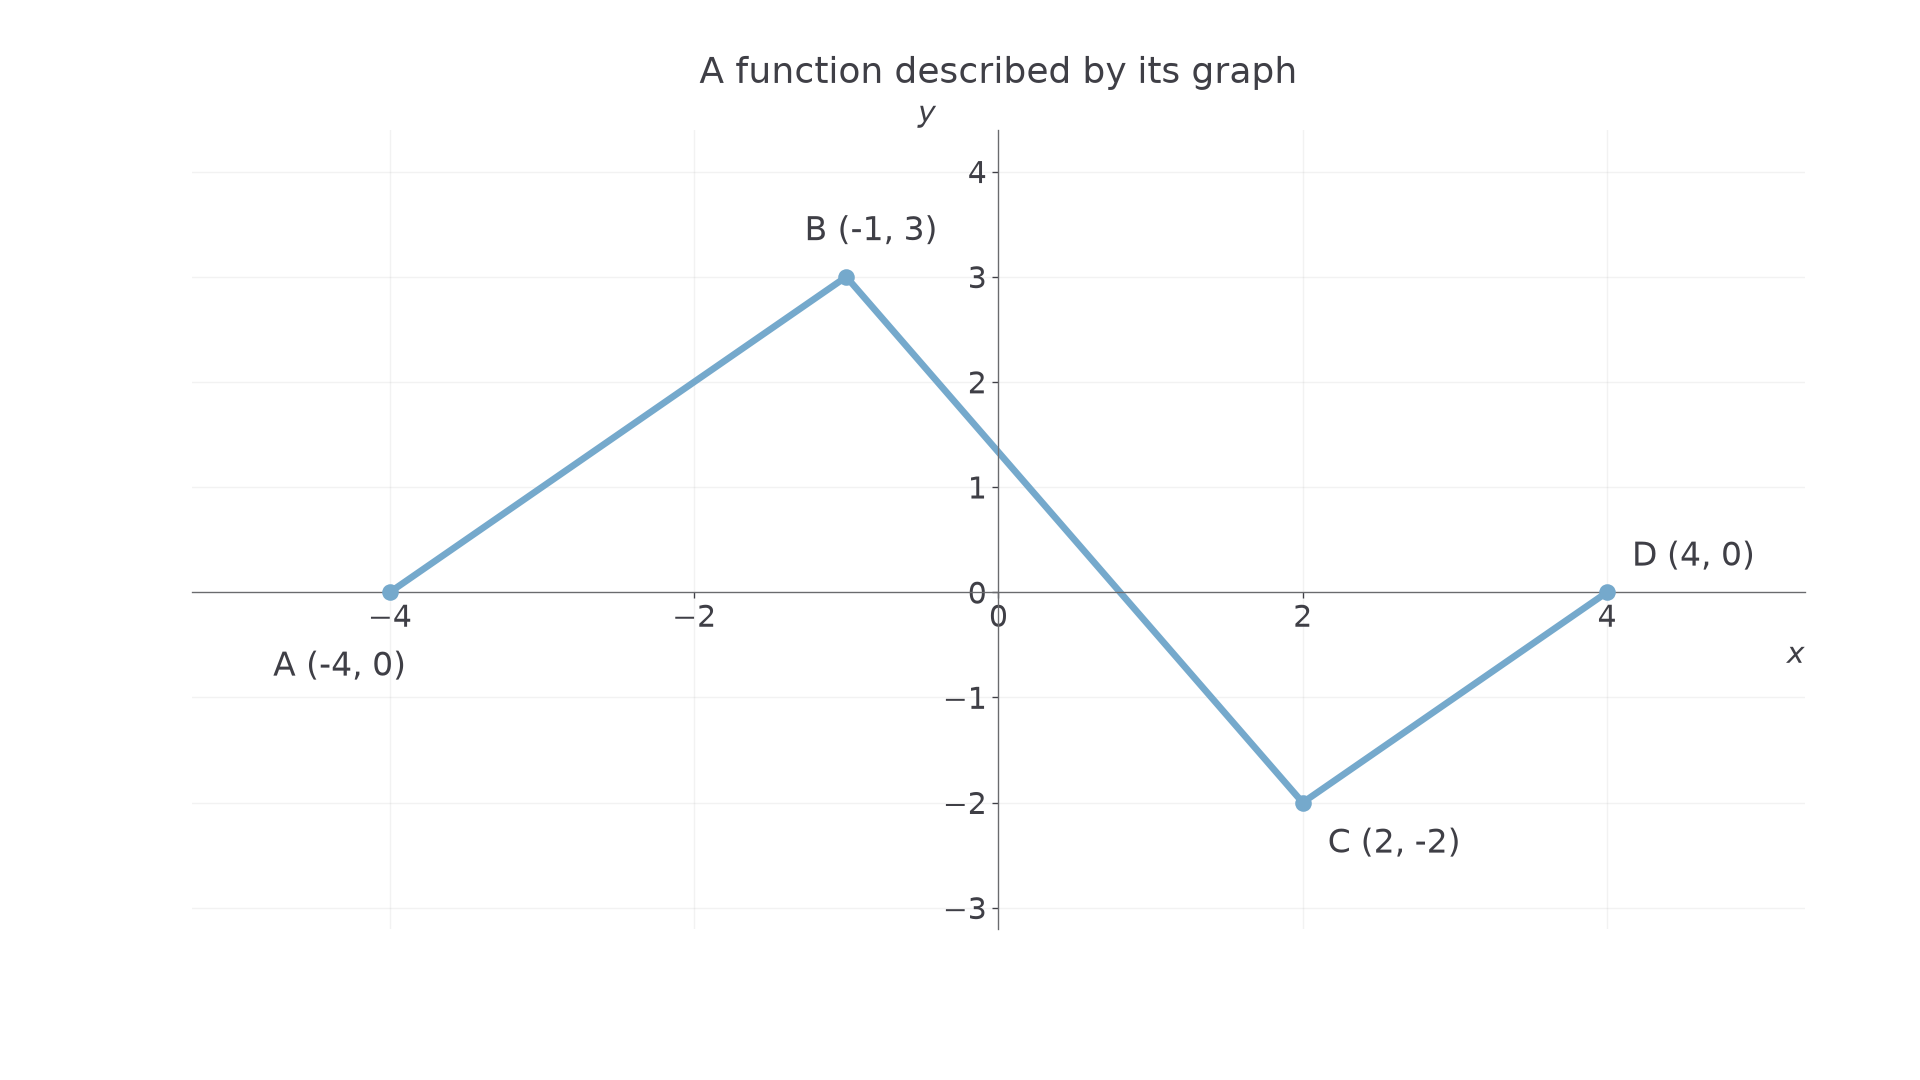
The graph below consists of straight segments joining , , and , with endpoints included. It has a corner maximum at and a corner minimum at . Its exact equation would add work without adding information.
[DIAGRAM: asset_name: A graph known by its points; asset_slug: unfamiliar-graph; caption: Transform the marked points, then join their images in the same order.; description: A piecewise linear graph joins A at negative four zero, B at negative one three, C at two negative two and D at four zero. Each vertex is labelled with its coordinates.]
Worked example 7: reflect an unfamiliar graph vertically
Question. For this graph, sketch and state its maximum and minimum values.
Plan. Negate each output, then join the mapped points with straight segments.
Reflection in the -axis turns the old maximum into a minimum, and the old minimum into a maximum.
Answer. Join . Maximum value at ; minimum value at . The input interval stays .
Check. The two zero-output endpoints stay on the -axis, as a reflection in that axis requires.
Change only which coordinate is negated: put the minus sign inside . This time heights, including the maximum and minimum values, are preserved.
Worked example 8: reflect an unfamiliar graph horizontally
Question. For the same graph, sketch and state its maximum and minimum values.
Plan. Negate each input and retain its output.
Join the images in their original connectivity; from left to right they now appear as .
Answer. Reflection in the -axis. Maximum value at ; minimum value at .
Check. The old statement becomes at , confirming the reflected maximum.
This also answers the opening question: adding to outputs moves to .
Quick Recap
- Outside changes act on outputs; inside changes require solving for the new input.
- Map useful points and asymptotes before drawing the shape.
- Negative multipliers reflect: outside in the -axis, inside in the -axis.
- A graph is enough information to transform a function; its equation is optional.