M1 3.1 - Reading motion graphs
Read motion from the gradient or area of a graph, with careful attention to the vertical axis. Distinguish displacement from distance and velocity from speed, including journeys that reverse direction.
Displacement-time slopes
A particle returns to its starting point after travelling . How can a graph show zero displacement without claiming that nothing happened? We need to distinguish a signed position change from the total path length.
Choose a positive direction along the line of motion. Displacement from a fixed reference point is signed. Distance travelled adds every length of path, regardless of direction. On a displacement-time graph, moving up the page means displacement is increasing, not necessarily that the particle is physically moving upwards.
For example, a rise of in gives velocity . This is the graph's gradient.
Displacement-time gradient
for a straight segment of a displacement-time graph. A horizontal segment means rest; a negative gradient means motion in the negative direction. On a curve, the tangent gradient gives instantaneous velocity. Not in the formula booklet: learn the graph interpretation.
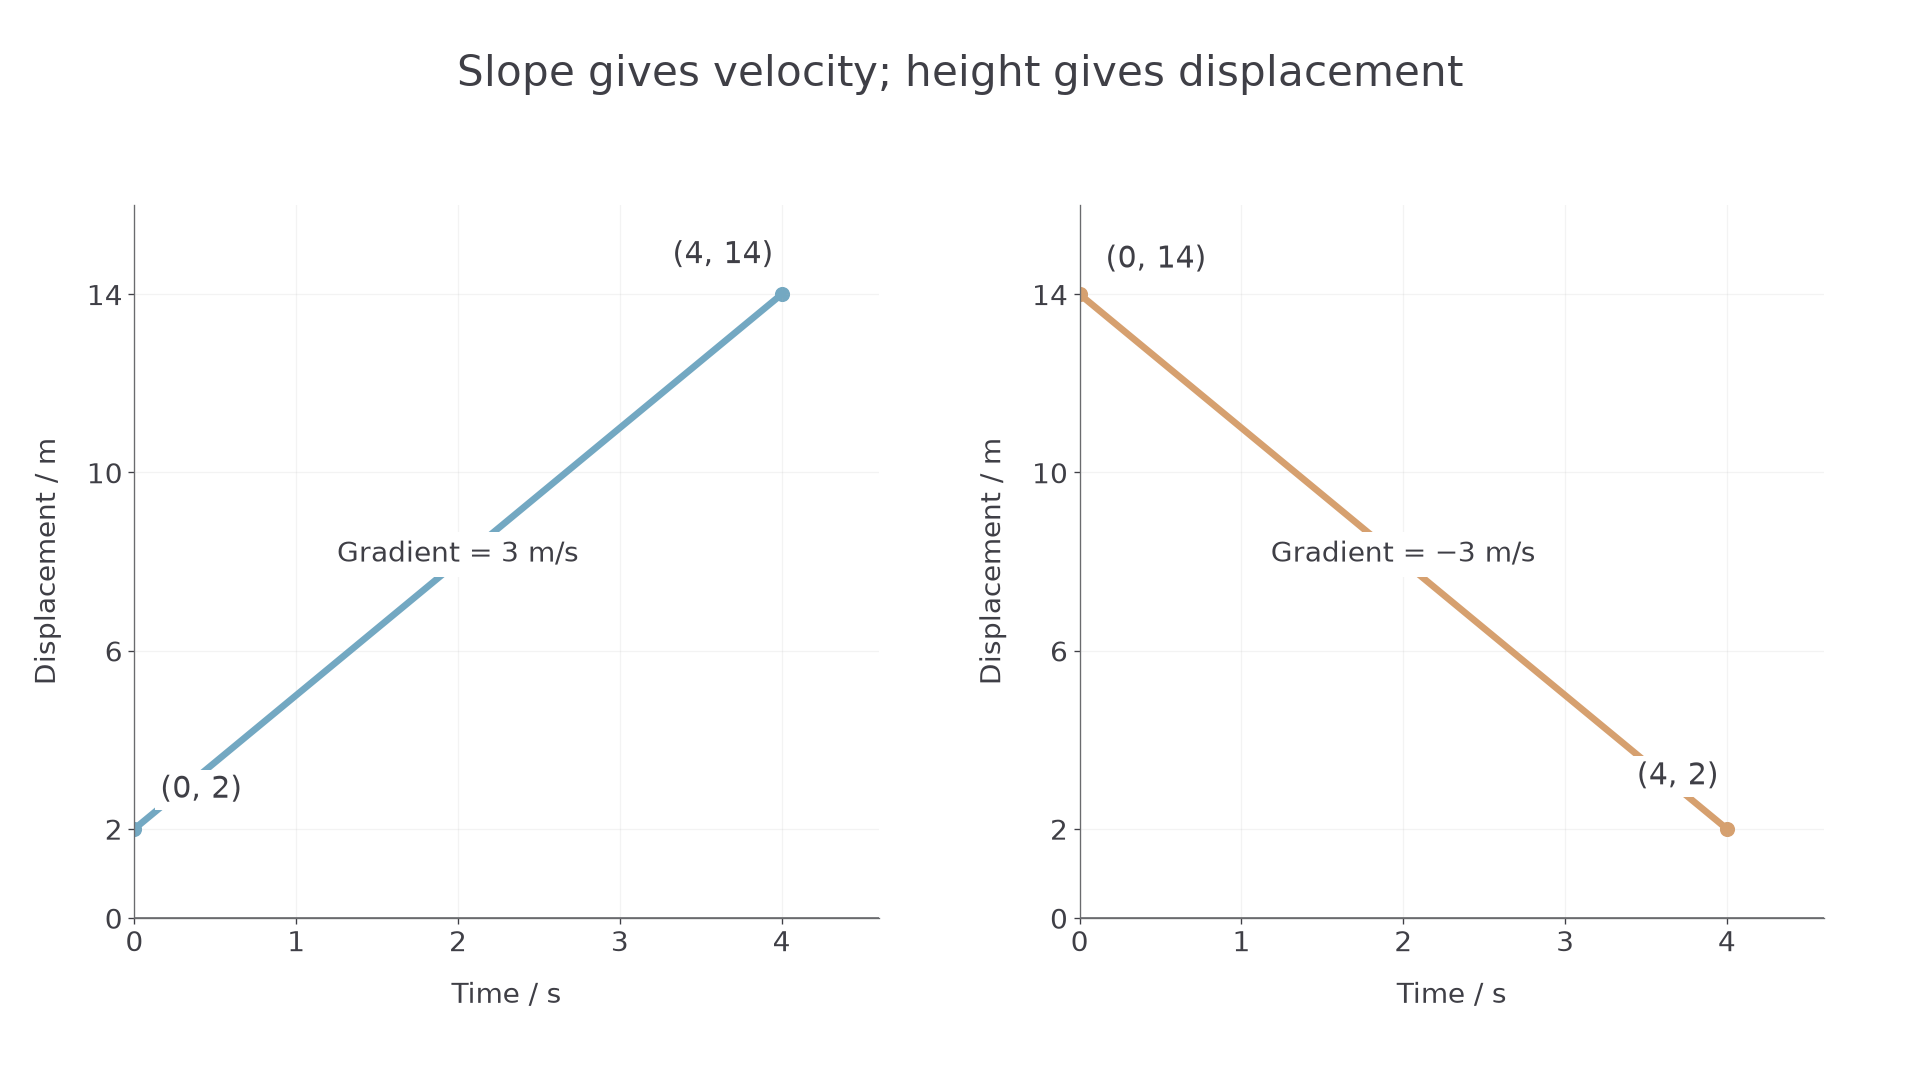
[DIAGRAM: asset_name: Displacement-time slopes; asset_slug: m1-displacement-slopes; caption: A downward-sloping displacement graph represents negative velocity, not a negative distance travelled.; description: Two displacement-time panels show a straight line from zero seconds two metres to four seconds fourteen metres, and a straight line from zero seconds fourteen metres to four seconds two metres, with gradients plus three and minus three metres per second.]
Worked example 1: positive slope
Question. A straight displacement-time segment joins to , with time in seconds and displacement in metres. Find the velocity and distance travelled over the segment.
Plan. Calculate the gradient; the constant sign means there is no reversal.
Answer. Velocity , distance .
Check. Four seconds at changes position by , from to .
Reverse only the order of the displacement values. The path length stays positive.
Worked example 2: negative slope
Question. A straight displacement-time segment joins to . Find the velocity and distance travelled, using the same units.
Plan. Keep final minus initial in the gradient, then take the size of the position change for distance.
Answer. Velocity , distance .
Check. , recovering the final displacement.
Compare heights for position and slopes for velocity.
Watch out
A higher point on a displacement-time graph does not mean a higher speed. Two parallel straight segments have the same velocity even if they are at different heights.
Use both the time difference and the signed displacement difference.
Velocity-time areas
The area between a velocity-time graph and the time axis gives displacement, with areas below the axis counted negatively.
During a short interval at constant velocity , displacement is : the area of a rectangle. For a linearly changing velocity, add thin rectangles or use the exact triangle/trapezium area. That is why the vertical-axis sign matters.
Velocity-time graphs
for a straight segment. A horizontal velocity graph means constant velocity, which may be nonzero. These graph interpretations are not printed in the formula booklet: learn them.
A straight segment from to over time has signed trapezium area , including when it crosses the axis. This can give zero or a negative result; neither means zero distance travelled.
Worked example 3: positive velocity throughout
Question. Velocity increases linearly from to over . Find displacement and acceleration.
Plan. Use trapezium area for displacement and gradient for acceleration.
Answer. Displacement , acceleration .
Check. The average velocity is halfway between and , namely ; .
Change only the final velocity to . The area now includes a negative region.
Worked example 4: crossing the time axis
Question. Velocity changes linearly from to over . Find displacement and acceleration.
Plan. Keep the signed velocities in the trapezium and gradient calculations.
Answer. Displacement , acceleration .
Check. The graph crosses zero after . The positive triangle has area ; the negative triangle has area . Their sum is .
[DIAGRAM: asset_name: Signed area under a velocity graph; asset_slug: m1-velocity-signed-area; caption: The two triangular regions contribute with opposite signs.; description: A straight velocity-time graph falls from two metres per second at zero seconds to negative eight metres per second at three seconds. It crosses the time axis at zero point six seconds. The positive triangle is labelled plus zero point six metres and the lower triangle minus nine point six metres.]
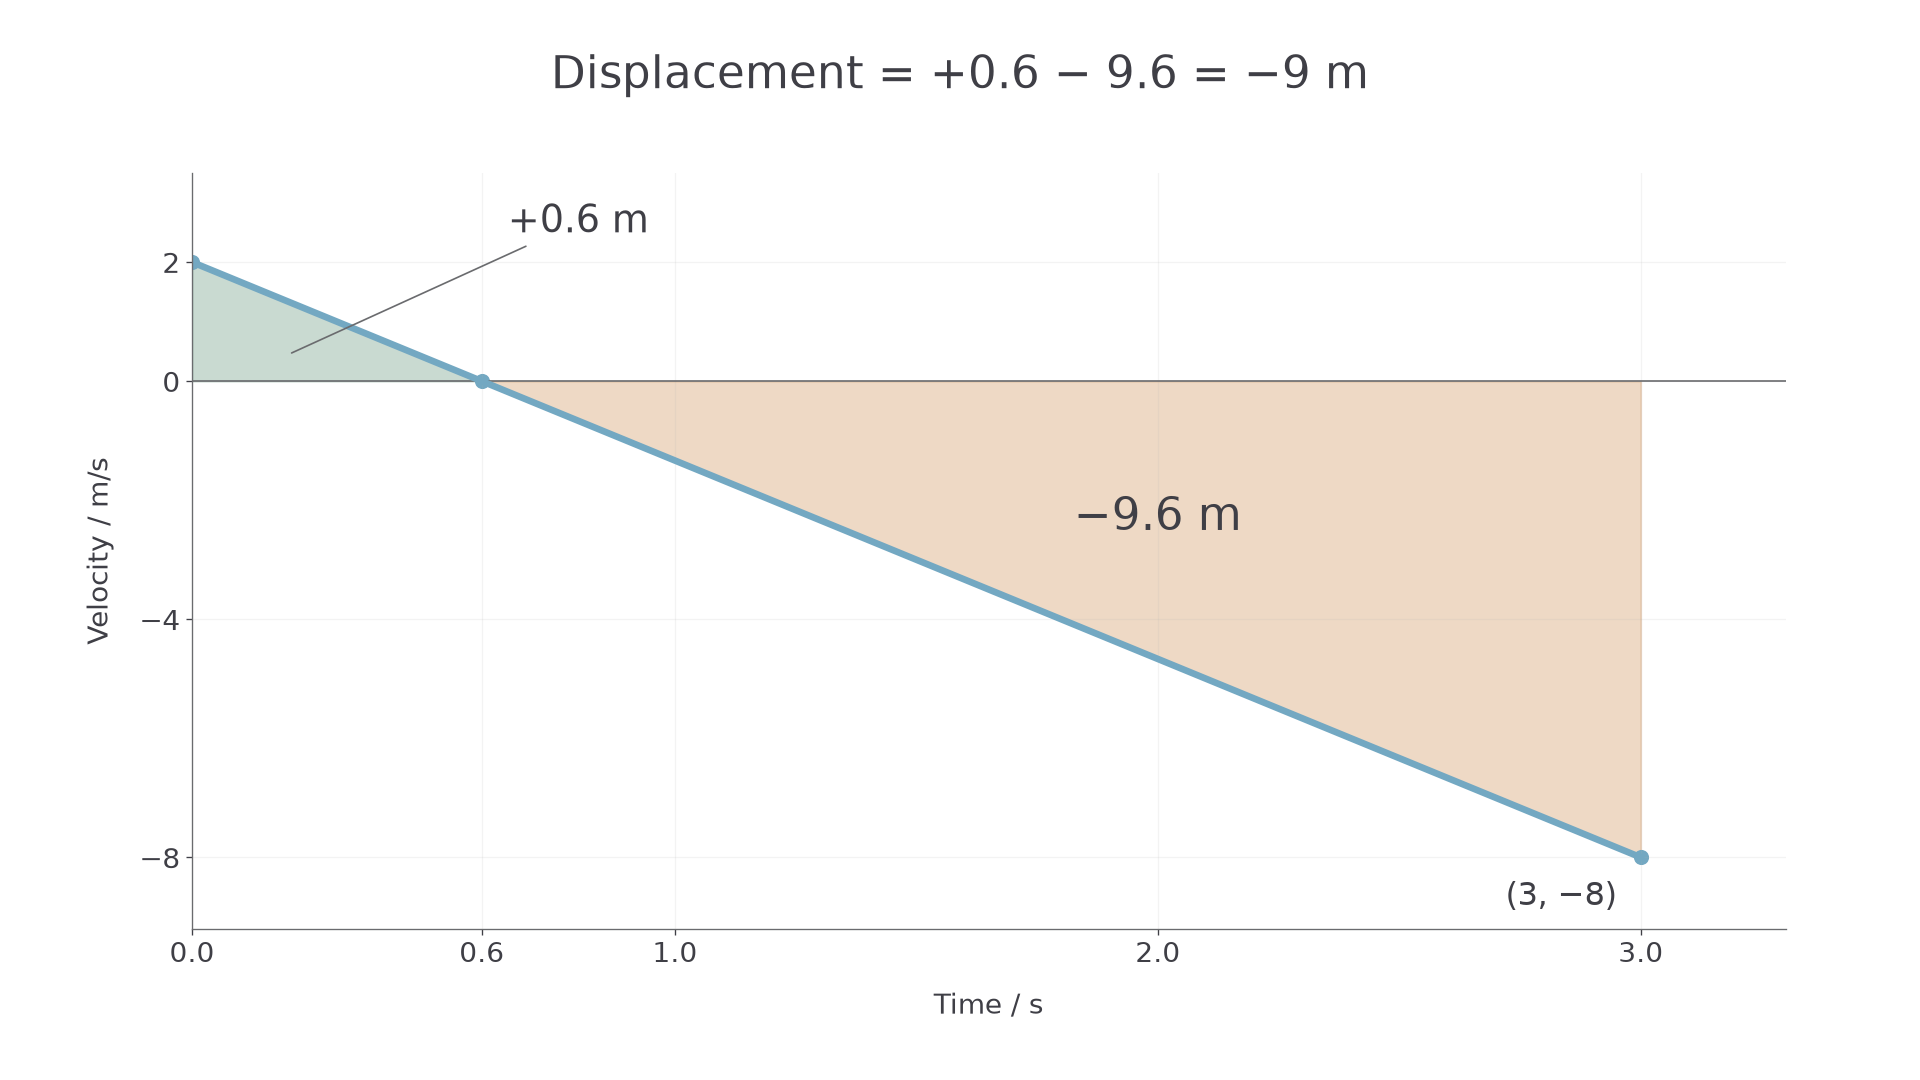
The sign reports the net direction from the starting point.
Continue this lesson.
You’re previewing NovaLearn without an account. Create a free account to read the rest.
Create free account