S1 3.4 - Tree diagrams and repeated sampling
Build probability trees, multiply conditional probabilities along a path and add disjoint paths. Model repeated random sampling with and without replacement, including probabilities given a specified result.
Multiplying along branches
A faulty item could have come from either of two machines. A tree keeps the machine choice separate from the chance of a fault within that machine's output.
A tree diagram splits an experiment into stages. Branches leaving the same node describe mutually exclusive, exhaustive possibilities, so their probabilities sum to . A later branch gives a probability conditional on the earlier path; it is not the probability of the complete path.
Suppose machine A supplies of items and machine B . The fault probabilities are for A and for B. Select one item at random from this combined output, and let D mean “faulty”.
[DIAGRAM: asset_name: Machine and fault probability tree; asset_slug: machine-fault-tree; caption: Branch probabilities are conditional; terminal probabilities multiply every branch on their path.; description: First branches A with probability zero point four and B with probability zero point six. From A, faulty D has probability zero point one and not faulty zero point nine. From B these probabilities are zero point three and zero point seven. Terminal joint probabilities are zero point zero four, zero point three six, zero point one eight and zero point four two.]
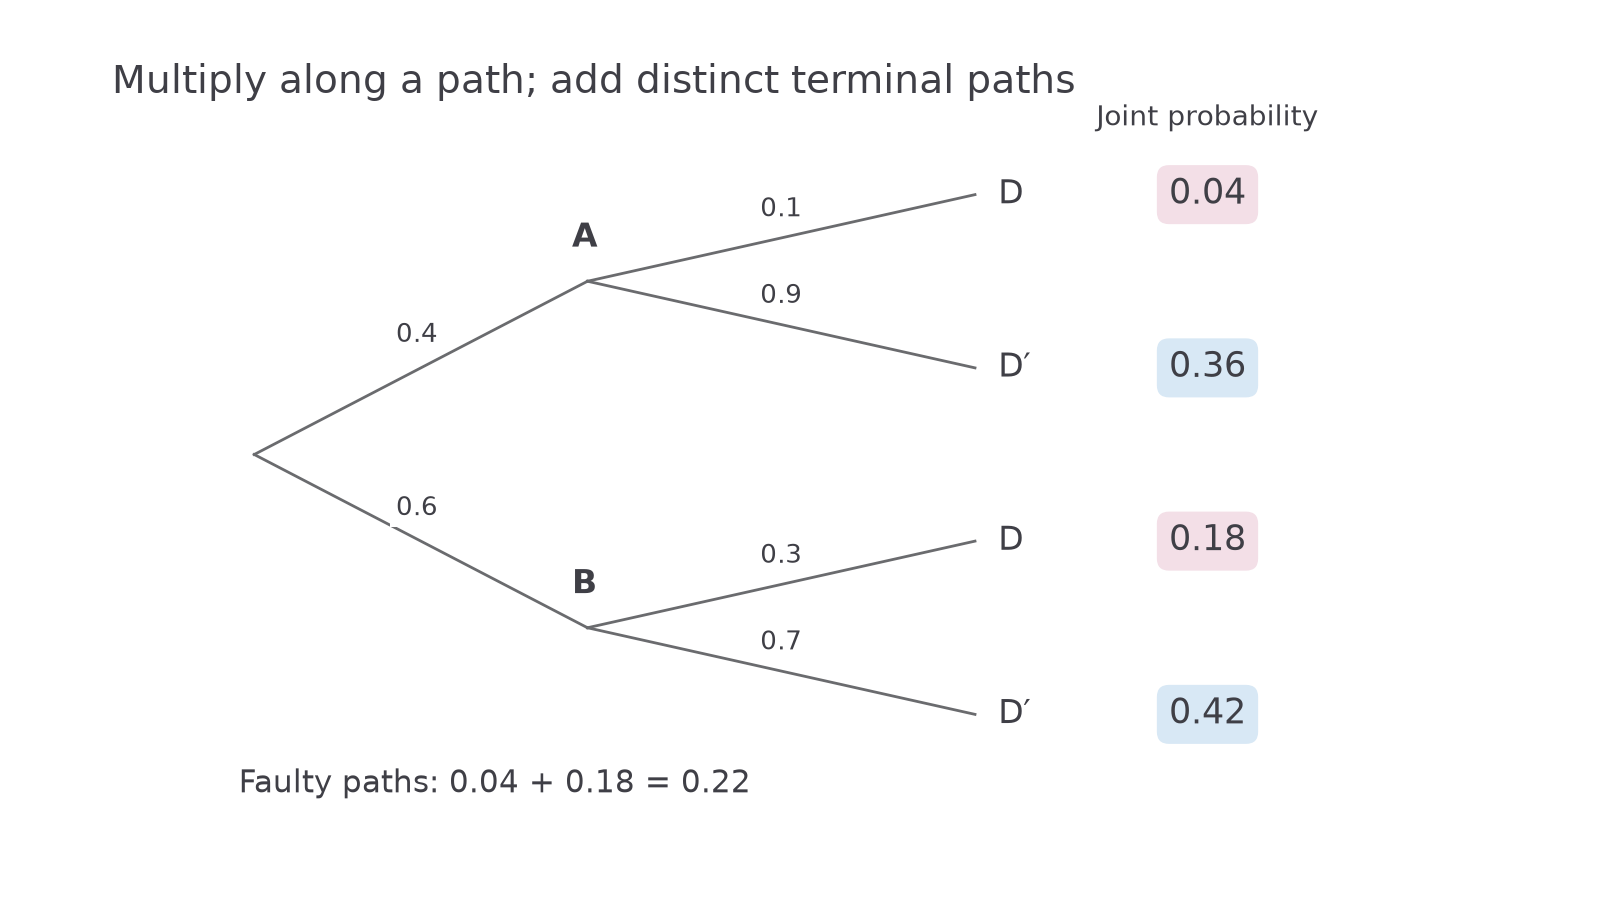
A path probability
Multiply along a complete path:
This is the product law printed in the S1 formula booklet. With more stages, each factor is conditional on the earlier selections along that path.
The whole path describes the intersection of its branch events.
Worked example 1
Find the probability that the selected item comes from A and is faulty.
Plan. Follow A then D and multiply those branch probabilities.
Answer. .
Check. In a hypothetical batch of items with exactly these proportions, come from A and of those are faulty: .
Change only the machine named in the required path. Its own conditional fault probability must change too.
Worked example 2
Find the probability that the selected item comes from B and is faulty.
Plan. Follow B then D, using B's conditional fault probability.
Answer. .
Check. B's two terminal probabilities are and ; they sum back to .
Do not label A's D branch . That is the terminal joint probability, whereas the branch itself must be .
Adding mutually exclusive paths
An event may be reached by several paths. Distinct complete paths cannot describe the same recorded sequence, so add their probabilities.
For the machine tree, a fault occurs along AD or BD:
Given a fault, the reference group is the faulty output, so . Multiplying by would assume an independence which the model does not have.
Consider a different two-stage model. A student succeeds at the first task with probability . Their probability of success at the second is after a first success, but after a first failure. Write S for success and F for failure at each stage. The four path probabilities are
They sum to , as every possible two-task record is included once.
Worked example 3
Find the probability of exactly one success in this two-task model.
Plan. Exactly one means SF or FS; include both orders and exclude SS.
Answer. .
Check. The other possibilities have zero or two successes, so .
Change only “exactly one” to “at least one”. The SS path now belongs to the event.
Worked example 4
Find the probability of at least one success in the same model.
Plan. Use the complement “no successes”, which is just FF.
Answer. .
Check. Direct addition gives . The increase from Example 3 is exactly .
Multiply for one complete sequence; add the different sequences that meet the event. “Exactly one” and “at least one” usually select different path sets.
Continue this lesson.
You’re previewing NovaLearn without an account. Create a free account to read the rest.
Create free account