P1 1.7, P1 1.9 - Solving inequalities
Find complete ranges of values that satisfy linear and quadratic inequalities. P1 1.9 supplies the algebraic solutions; P1 1.7 connects them to graph positions, including a curve below a line and fractions with excluded values.
Linear inequalities with brackets and fractions
If , is every number less than allowed? The answer is no: fails. Inequalities ask for a whole set of values, so a correct boundary is only the beginning.
First consider linear expressions. Adding or subtracting the same quantity preserves order. Multiplying by a positive number also preserves order: gives . Multiplying by reverses their positions on the number line: .
Order rules
For real , if , then
For , ; for , . Division follows the same sign rule.
Not in the formula booklet: learn it.
Expand brackets carefully. Clear fixed positive denominators by multiplying every term by their lowest common multiple. If you later divide by a negative coefficient, reverse the inequality.
Worked example 1: brackets and a negative coefficient
Question. Solve .
Plan. Expand, collect -terms on the left, then divide.
Answer. .
Check. gives , true. At the excluded boundary , both expressions equal .
Change only the left expression by dividing it by . Clearing this positive denominator preserves the inequality, although the boundary changes.
Worked example 2: a fixed denominator
Question. Solve .
Plan. Multiply both sides by before expanding and collecting.
Answer. .
Check. At , , true. At , , false, matching the two sides of the boundary.
A strict inequality excludes its endpoint. Replacing with throughout the same calculation includes the endpoint instead.
Watch out
From , the answer is , not . Division by a negative reverses order; adding a negative does not.
Use a positive common denominator first.
Quadratic sign diagrams
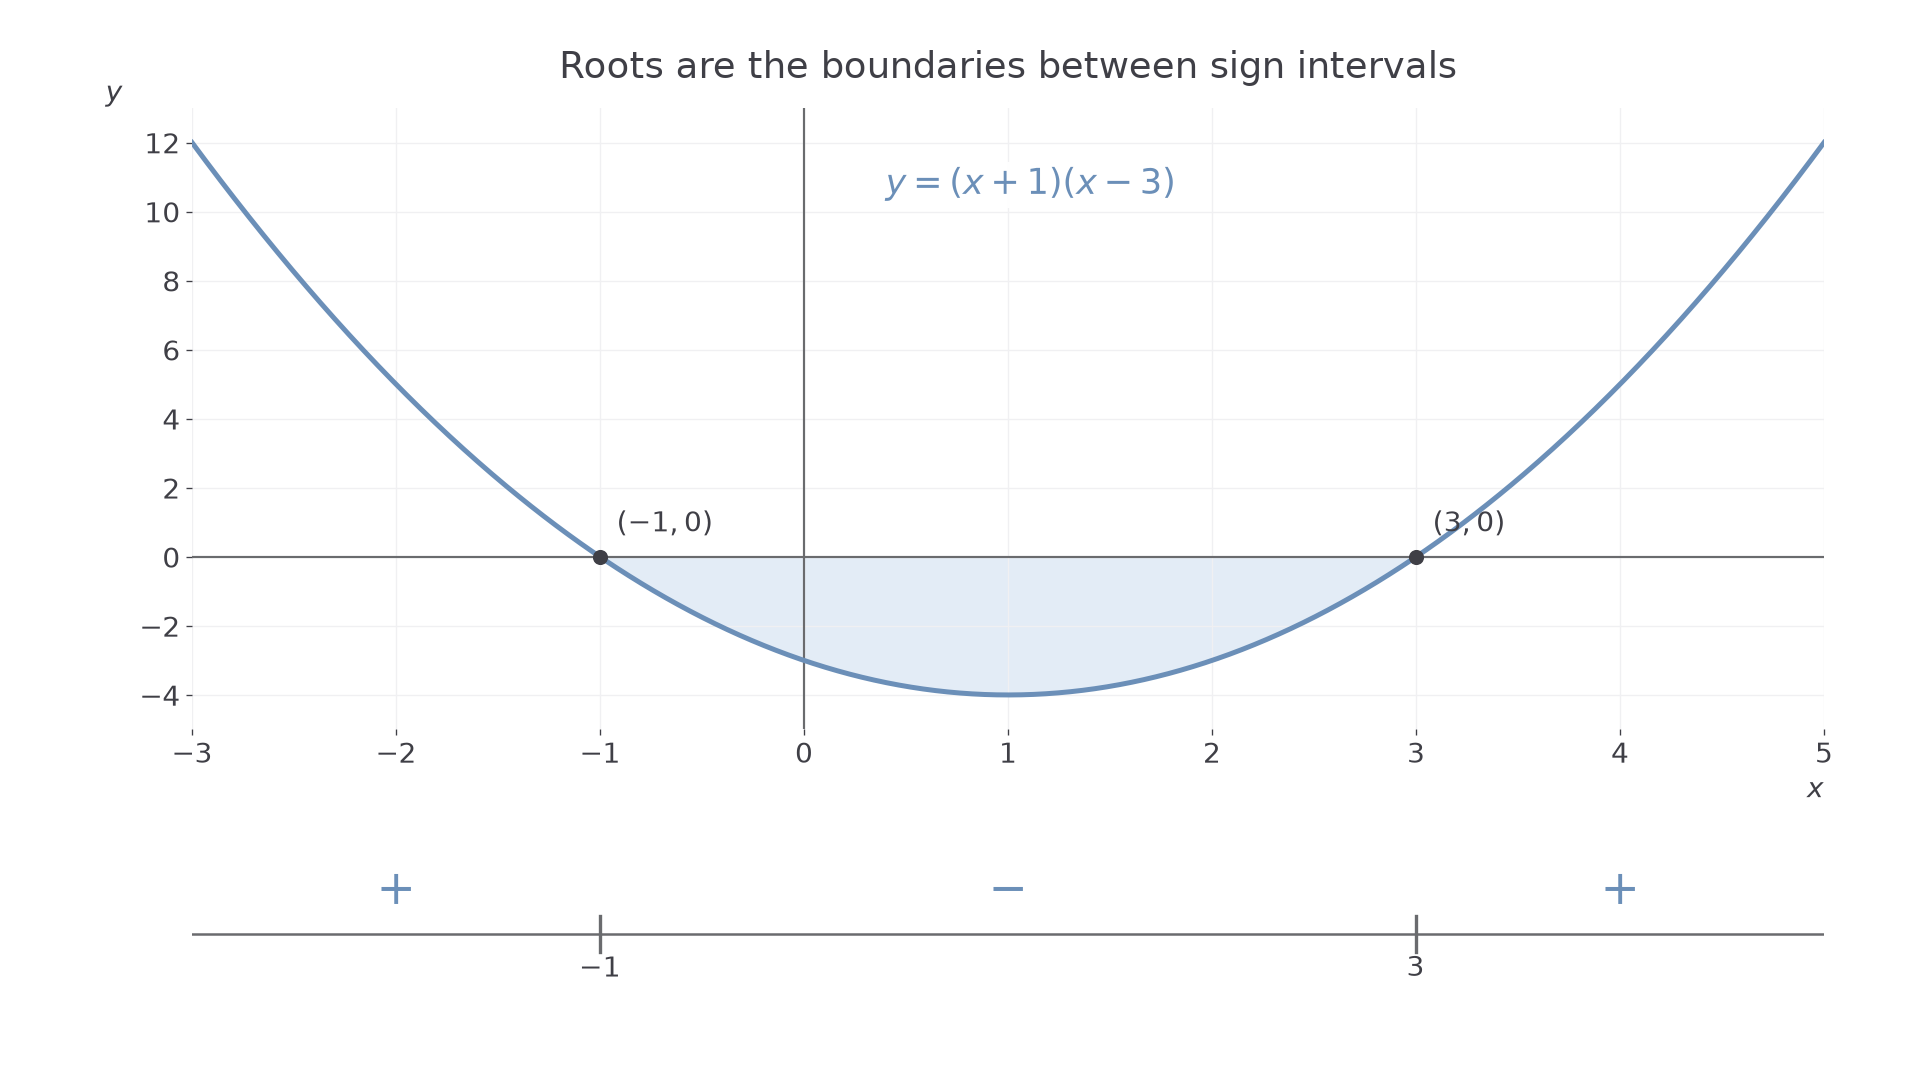
A quadratic's roots split the number line into intervals where its value is positive or negative.
For , take one value in each interval. At , both factors are negative, so their product is positive. At , the factors have opposite signs, giving a negative product. At , both are positive. The quadratic is continuous and has no other zeros, so its sign cannot change inside one of these intervals.
Sign diagram
A sign diagram records where an expression is positive, zero or negative. Put its zeros in order, then label the sign on each intervening interval. For a fraction, also mark any excluded values.
The sign diagram describes the same information as a graph's position above or below the horizontal axis.
[DIAGRAM: asset_name: Roots divide a quadratic into sign intervals; asset_slug: quadratic-sign-intervals; caption: A positive-leading quadratic is negative between its two distinct roots.; description: The graph y equals x plus one times x minus three crosses at minus one and three. A number-line sign strip below shows positive, negative, positive on the three intervals.]
Worked example 3: positive leading coefficient
Question. State where is positive, negative and zero.
Plan. Locate the roots and examine the factors in each interval.
Answer. Positive for or ; negative for ; zero at .
Check. The test values give , respectively.
Change only the sign of the entire expression. The roots stay fixed while every nonzero output changes sign.
Worked example 4: negative leading coefficient
Question. State where is positive, negative and zero.
Plan. Use the same boundaries and reverse the product's signs.
Answer. Positive for ; negative for or ; zero at .
Check. Its expanded form is , a downward-opening parabola. At , its value is , between the roots.
A repeated root behaves differently. Since , its sign is positive on both sides of and zero at . A repeated factor need not change sign at its root.
Watch out
The pattern positive, negative, positive requires a positive-leading quadratic with two distinct real roots. Check the leading coefficient and repeated roots before using a remembered picture.
Build the signs rather than assuming the outer intervals are positive.
Solving quadratic inequalities
To solve a quadratic inequality, first find the boundary roots, then select the intervals with the required sign.
For , factorising gives boundaries and . The parabola opens upwards, so it is below the axis between them. This answers our opening question: means , rather than just .
Key idea
Roots locate the boundaries. The sign of the quadratic selects the intervals. The symbols and include zeros; and exclude them.
Move all terms to one side before analysing signs, so the comparison is with zero.
Worked example 5: values between roots
Question. Solve .
Plan. Factorise, identify the graph's shape and select the negative interval.
The leading coefficient is positive, so the sign pattern is positive, negative, positive.
Answer. .
Check. gives , while gives , false. The strict sign excludes both roots.
Change only the requested sign, from to . Use the same roots and signs, but choose the opposite intervals and include the endpoints.
Worked example 6: two outer intervals
Question. Solve .
Plan. Reuse the roots and , selecting positive values and zeros.
Answer. or .
Check. gives , and gives . At either boundary the value is zero, which is allowed.
Some quadratics have no distinct sign intervals. For example, has no real solution, whereas has just . Also, holds for every real .
Watch out
The two outer intervals are joined by or. Writing and would require one number to meet both conditions, which is impossible.
Identify the sign and endpoint conditions separately.
Curve below a line and fractional inequalities with exclusions
Comparing a curve's height with a line's height gives an inequality in , and the same sign reasoning can handle simple fractional expressions.
For the curve to lie below , we need . Their intersections mark where the vertical difference is zero.
Worked example 7: where a curve is below a line
Question. Find the values of for which is below .
Plan. Subtract the line's height and select where the difference is negative.
The positive-leading quadratic is negative between its roots.
Answer. .
Check. At , the curve's height is below the line's height . At , is above , as the interval predicts.
Change only the line's constant term, from to . The algebra still compares heights; only the intersection boundaries move.
Worked example 8: new intersection boundaries
Question. Find where is below .
Plan. Form and solve the quadratic inequality for the height difference.
Answer. .
Check. At , , true; at , , false. Both endpoints give equal heights and are excluded.
A variable denominator introduces a different issue: its sign is unknown. In , multiplying by without a case split is unsafe. Instead, record and multiply by , which is strictly positive for every allowed :
This gives a quadratic inequality while preserving its direction. The excluded value must survive the transformation.
Worked example 9: a positive numerator
Question. Solve .
Plan. Exclude zero, multiply by positive , then use signs.
The product is positive outside its roots and .
Answer. or .
Check. gives , and gives . In the rejected interval, gives , false.
Change only the numerator's sign. The denominator restriction stays the same, but the other boundary moves to the left of zero.
Worked example 10: a negative numerator
Question. Solve .
Plan. Preserve and multiply by again.
Answer. or .
Check. At , ; at , . At , is false.
In a non-strict fractional inequality, a transformed boundary may look admissible even though the original expression is undefined there.
Watch out
For , the quadratic gives or , but is forbidden. The final answer is or .
Carry the exclusion through your own solution.
Quick Recap
- Reverse an inequality when multiplying or dividing by a negative number.
- Find quadratic roots, then select whole sign intervals with the correct endpoints.
- A curve is below a line where curve height minus line height is negative.
- Preserve denominator exclusions; multiplying by avoids guessing the sign of .
Our opening inequality has the complete solution .