D1 1.1 - Following an algorithm
Follow instructions written as a flowchart or a numbered procedure, recording how each value changes. You will also learn the middle-item convention used throughout searching and sorting, where choosing the wrong middle item changes the whole trace.
Inputs operations decisions and outputs
If you start with , add , then double, do you get the same result as doubling first and adding ? The first route gives ; the second gives . An algorithm depends on the order of its instructions.
Algorithm
An algorithm is a finite sequence of precise instructions for solving a problem. Its input is the information supplied; its output is the result produced after the instructions have been followed.
A variable stores a value which can change. The instruction means “replace the current value of by that value plus ”. It is an assignment, not an equation to solve. At , the new stored value is ; a following instruction uses .
An operation changes or calculates a value. A decision selects a route by testing a condition, such as . Exactly one of its Yes and No branches is followed. An output instruction reports a value; it does not change it unless a separate instruction says so.
For input , the instructions “set ; if , output ; otherwise output ” first store , then take the Yes branch and output . The unused branch is not another calculation to carry out.
Key idea
Read one instruction at a time, using the most recently stored values. A condition is tested when you reach it, not using the original input throughout.
The next check separates the stored value from the value reported.
Tracing flowcharts
A flowchart makes the route through an algorithm visible, including instructions which are repeated.
An oval marks the start or stop. A parallelogram is an input or output; a rectangle is an operation; a diamond is a decision. Follow the arrow leaving the shape. When an arrow returns to an earlier decision, test it again with the updated values. This repeated section is a loop.
[DIAGRAM: asset_name: A repeated addition flowchart; asset_slug: repeated-addition-flowchart; caption: Add the current value of n, reduce n by two, and test the updated value.; description: Start leads to input positive integer n, then s equals zero, then a decision n greater than zero. The Yes branch adds n to s and then subtracts two from n before returning to the decision. The No branch outputs s and stops.]
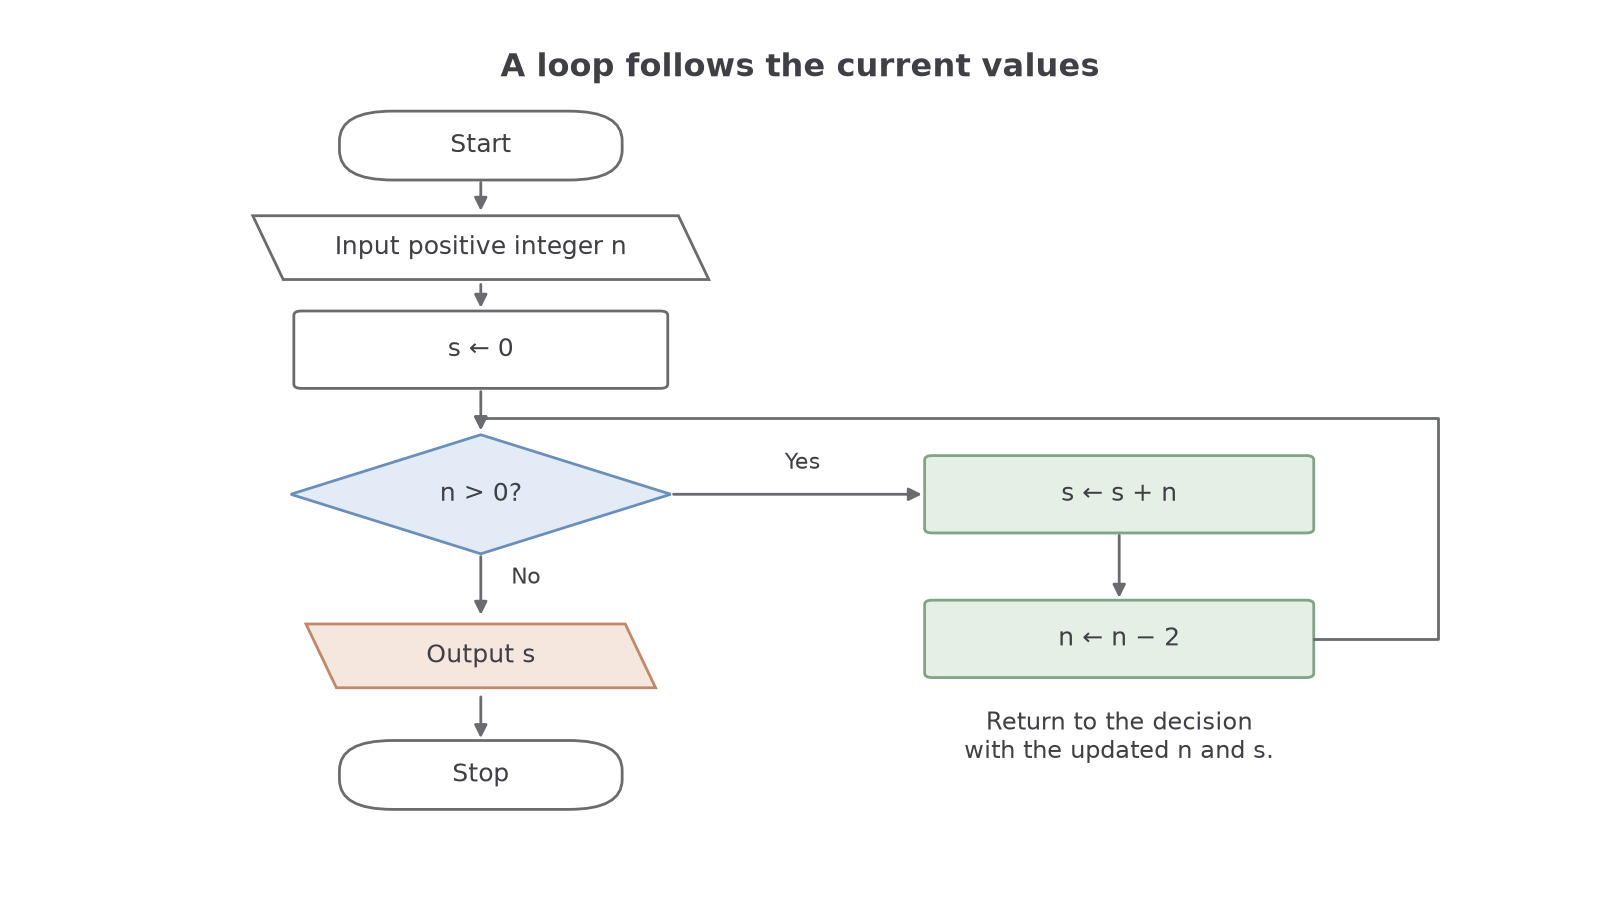
The flowchart adds every other positive integer downwards from the input. A trace table records the stored values at a consistent point: here, immediately before each visit to the decision.
Worked example 1: an even input
Trace the flowchart for .
Plan. Record and before each test; apply both operations only after a Yes result.
| Is ? | Action | ||
|---|---|---|---|
| Yes | Add , then reduce | ||
| Yes | Add , then reduce | ||
| Yes | Add , then reduce | ||
| No | Output |
Answer. The output is .
Check. The positive values added are , and . The final fails the test and is not added.
Change only the input from to . The loop now visits odd values and finishes at .
Worked example 2: an odd input
Trace the same flowchart for .
Plan. Use exactly the same decision and updates; do not stop merely because the values become small.
| Is ? | ||
|---|---|---|
| Yes | ||
| Yes | ||
| Yes | ||
| Yes | ||
| No |
Answer. The output is .
Check. . Subtracting from the last positive value gives , which correctly takes the No branch.
The order of the two updates matters: the flowchart adds the old before reducing it.
Watch out
Do not write in place of the two given operations. That would miss the first term and add a different sequence.
Use the same trace layout with a fresh input.
Continue this lesson.
You’re previewing NovaLearn without an account. Create a free account to read the rest.
Create free account