P2 5.1 - Exponential functions
Understand how a variable exponent produces growth or decay, and use exact values to describe exponential graphs. You will identify their intercepts and asymptotes, including after a vertical translation.
Positive bases and exponential growth
If a quantity doubles at each step, can its graph ever pass through zero? Starting with one gives the values , but extending the rule backwards gives . The values become small without becoming zero. We will explain the complete graph, including what happens between whole-number steps.
You already know that and . An exponential function lets the exponent itself vary: . It differs from , where the base varies and the exponent stays fixed.
Exponential function
An exponential function has the form , where the constant base satisfies and . Its domain is all real , and its values are positive.
A positive base makes the function real-valued throughout this domain. For instance, is not real, so a negative base cannot give this all-real-domain exponential graph. Base is excluded because is constant.
For , increasing increases . In particular,
Every increase of one in multiplies the output by the same factor ; it does not add the same amount. This is exponential growth. More generally, an increase of multiplies the output by .
Worked example 1: evaluating a growth function
Question. For , find when .
Plan. Read a negative index as a reciprocal, zero as one and a half as a square root.
Answer. The outputs, in the requested order, are .
Check. At the intermediate input , the output is . Each whole step from to to multiplies by , giving .
Change only the base from to . The same index meanings apply, but the growth over each unit interval is larger.
Worked example 2: changing the growth factor
Question. For , find when .
Plan. Use the same four index rules with the new base.
Answer. .
Check. Since , squaring the four answers in Example 1 gives exactly these four outputs.
The common starting value is not a coincidence: every allowed base has .
Watch out
, not . Equal steps in the input give equal multiplication factors in the output.
Try a different base with the same index meanings.
Decay with a base between zero and one
Multiplication can make a positive number smaller: multiplying repeatedly by halves it at every step.
For , the outputs at are . Moving right makes the graph fall; moving left makes it rise. These are the values of with the sign of the input reversed, so the two graphs are reflections in the -axis.
Exponential decay
For , is an exponential decay function. It is decreasing: a larger input has a smaller output. Each increase of one in multiplies the output by , and every output remains positive.
For any positive input step , the multiplying factor lies between zero and one. The decrease is therefore continuous, rather than confined to the integer points.
Worked example 3: a decay table
Question. Find the outputs of at .
Plan. Use reciprocals at negative inputs, then halve the output at each step to the right.
Answer. .
Check. Consecutive outputs have ratio : for example, . The negative-input values are greater than one, as the reciprocal rule predicts.
Change only the base to . Each whole step now quarters the output.
Worked example 4: a smaller decay base
Question. Find the outputs of at .
Plan. Start from at , dividing by to move right and multiplying by to move left.
Answer. .
Check. ; squaring Example 3's outputs reproduces the entire table.
A negative exponent reverses the fraction; it does not make the output negative.
Watch out
, not . A decay function falls as increases, but it still has positive values at every real input.
Use the same table method with a new decay factor.
Graphs intercepts and asymptotes
An exponential graph passes through and approaches the horizontal axis at one end without meeting it.
For growth, the values get arbitrarily small as becomes more negative. For decay, they get arbitrarily small as becomes more positive. At every finite input, however, .
Horizontal asymptote
A horizontal asymptote is a horizontal line approached by a graph as the input becomes indefinitely large in one direction. Both growth and decay graphs have asymptote , -intercept , no -intercept and range .
The curve is smooth through its points. Do not join a value table with straight segments or let a sketch touch the asymptote. After a vertical translation, the asymptote moves with the curve.
[DIAGRAM: asset_name: Growth decay and a translated asymptote; asset_slug: exponential-graphs; caption: Growth and decay share an intercept and asymptote; shifting a graph down moves both.; description: Two panels. The first shows y equals two to the x and y equals one half to the x on labelled axes, meeting at zero comma one and approaching y equals zero at opposite ends. The second compares y equals two to the x with y equals two to the x minus three, marking the intercept zero comma negative two and the new dashed asymptote y equals negative three.]
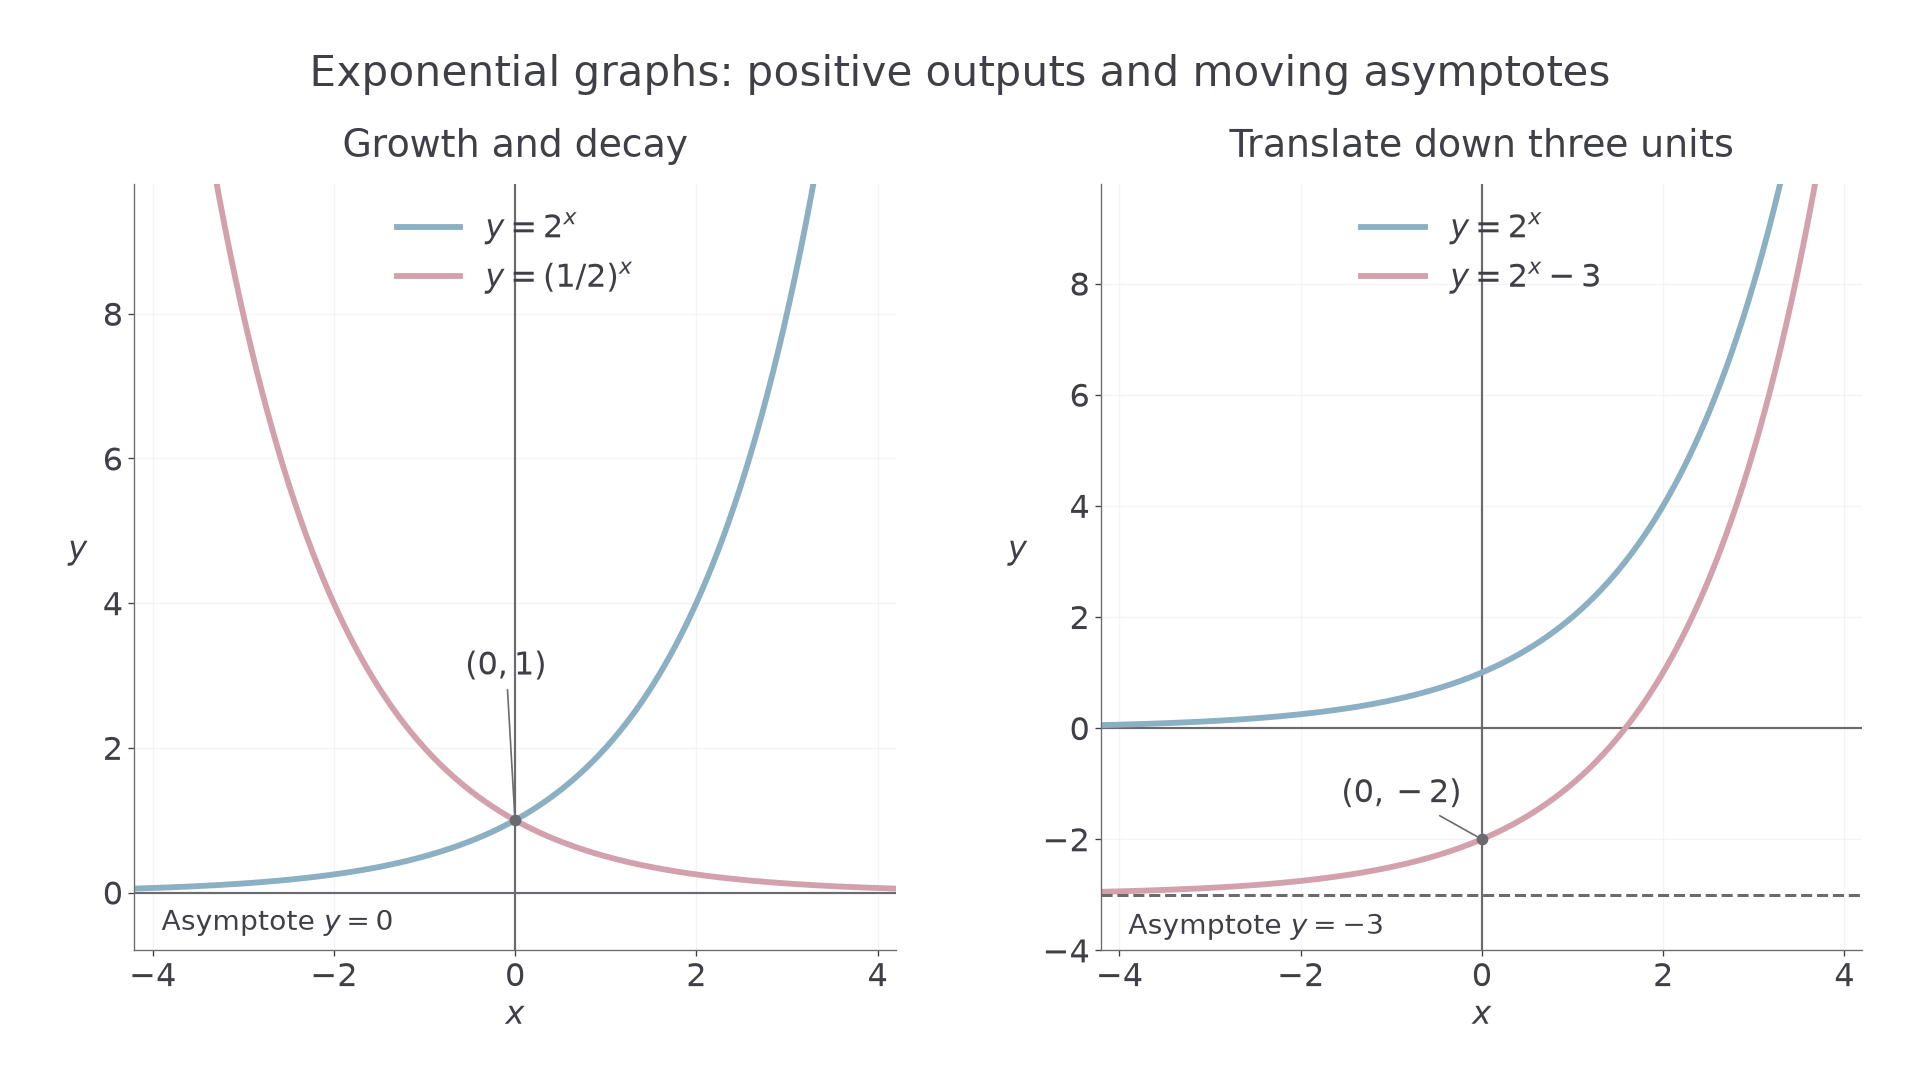
Worked example 5: describing the basic graph
Question. Describe the intercepts, horizontal asymptote, domain and range of .
Plan. Substitute for the vertical intercept, then use positivity and the negative-input behaviour.
As decreases indefinitely, approaches zero. As increases, the output grows without bound.
Answer. The -intercept is ; there is no -intercept. The asymptote is , the domain is all real , and the range is .
Check. and : the left tail is close to, and above, zero, while the right tail rises.
Change only the vertical position by subtracting . The domain and increasing shape stay the same, while every output decreases by .
Worked example 6: translating the graph
Question. Describe the intercepts, horizontal asymptote, domain and range of . Give an equation determining its -intercept.
Plan. Shift the previous graph down three units, and set each coordinate to zero in turn.
The equation has one solution between and , since and the function increases. A later lesson will calculate it.
Answer. The -intercept is . There is one -intercept, where . The asymptote is , the domain is all real , and the range is .
Check. At , , just above the new asymptote. At and , the outputs are and , confirming a crossing between them.
The opening doubling function never reaches zero because all its powers are positive. A translated version can cross an axis: the restriction belongs to the original output , not every expression containing it.
Watch out
The asymptote is a line, so write , not . A vertical shift changes the asymptote and range together.
Apply that single shift to a new graph.