P3 3.3 - Straightening curves with logarithms
A curved graph can hide a simple relationship. Use logarithms to turn power and exponential models into straight lines, estimate their constants and translate the axes back into the original quantities.
Power models from log-log graphs
How could a straight ruler help you discover the equation of a curve? If doubling multiplies by four, a power model such as is plausible. Logarithms turn that multiplication into addition.
Throughout this lesson, means . Both and must be positive when their logarithms are taken. For , with , the log laws give
Compare this with . Set and : the gradient is , while the vertical intercept is .
Log-log graph
A log-log graph plots vertically against horizontally. A power model becomes
The exponent is the gradient; the coefficient is the antilogarithm of the intercept. This transformation follows from the log laws; learn it rather than expecting it in the formula booklet.
[DIAGRAM: asset_name: A power curve becomes a line; asset_slug: power-log-line; caption: The power curve becomes a straight line when both coordinates are replaced by their logarithms.; description: Two panels show y equals five x squared for positive x and log base ten y against log base ten x. Original points one five and ten five hundred become zero log five and one two plus log five. The transformed gradient is two and vertical intercept is log five.]
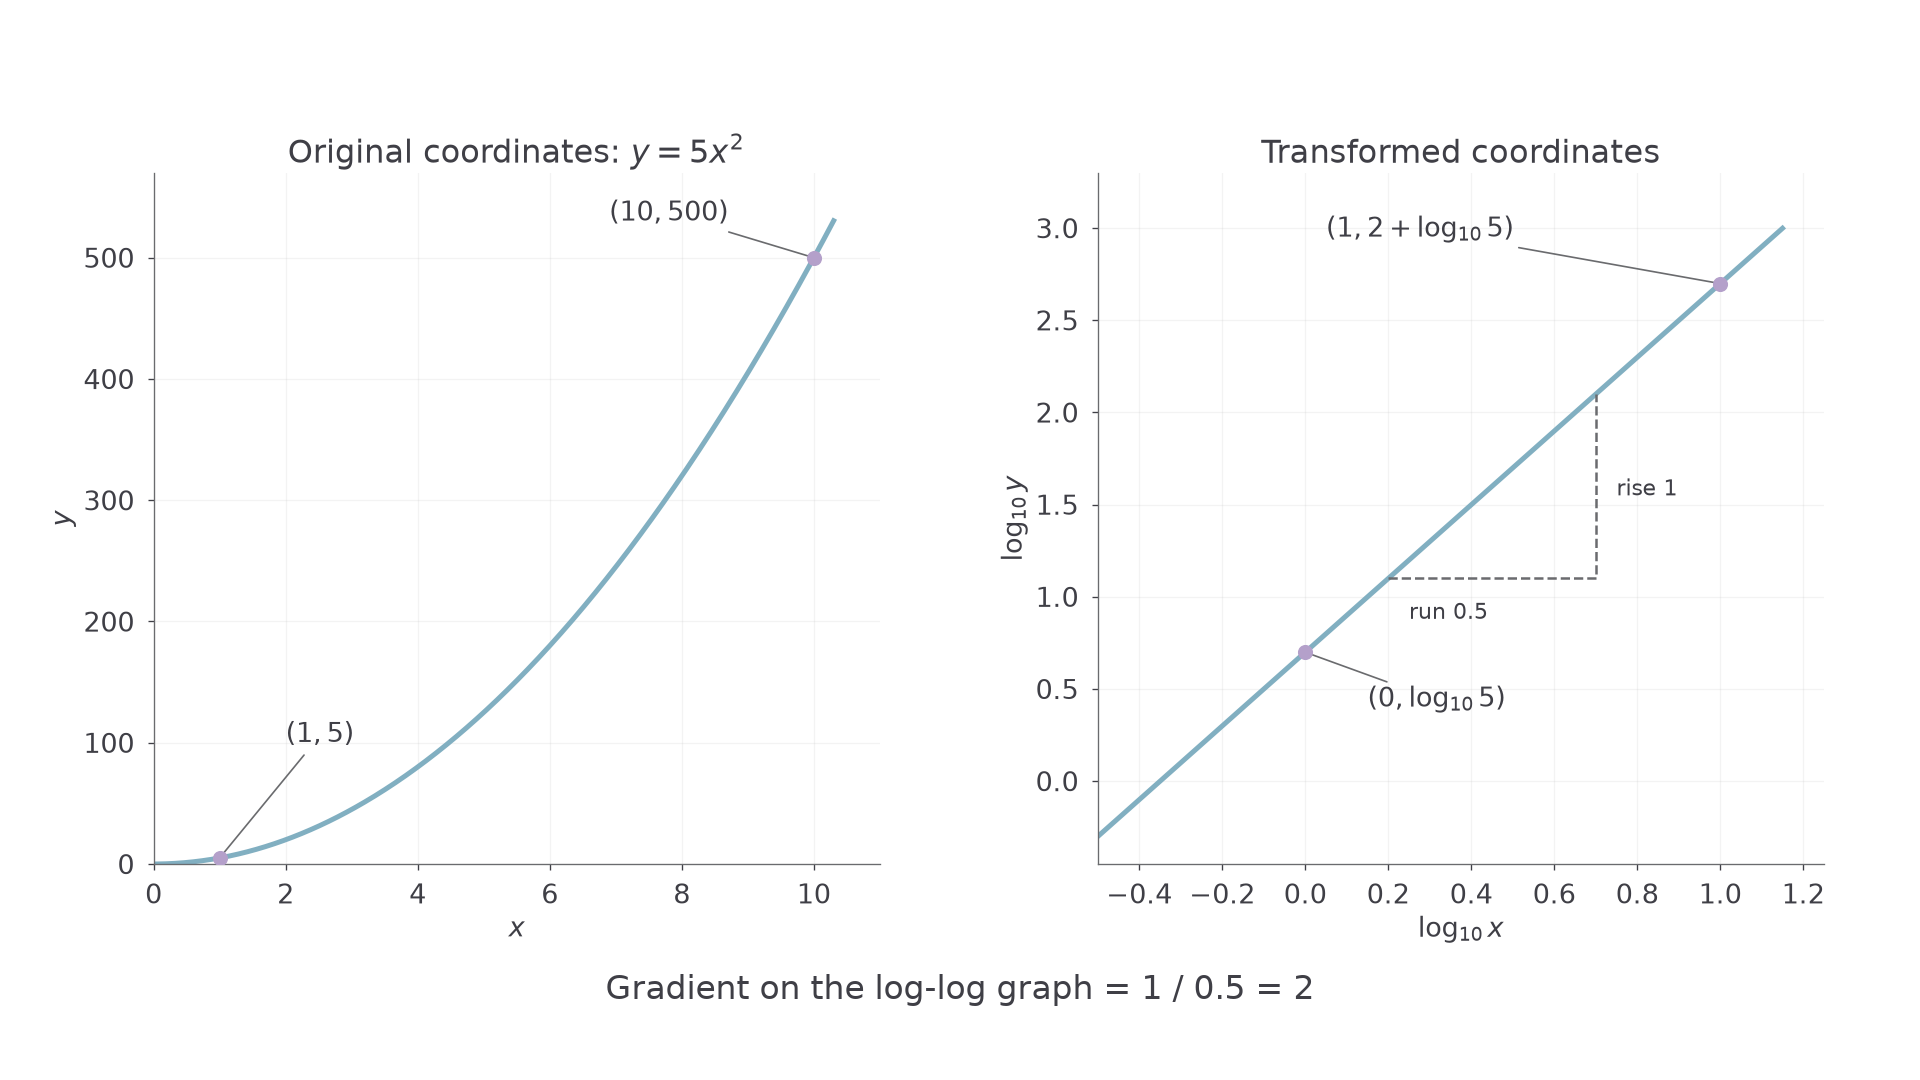
The transformed graph is a new plot of new coordinates. The original curve has not suddenly become straight on its original axes.
Worked example 1: a positive power
Write the straight-line equation obtained by plotting against when , . State its gradient and intercept.
Plan. Take logarithms and separate the product and power.
Answer. Gradient , vertical intercept .
Check. At , . The transformed point is , and .
Change only the exponent from to . The line now slopes downwards; the coefficient stays the same.
Worked example 2: a negative power
Write the straight-line equation for , , on the same transformed axes.
Plan. Keep the negative sign when bringing the power down.
Answer. Gradient , vertical intercept .
Check. At , , so , as the line predicts.
A negative gradient is compatible with positive values of both original variables.
Exponential models from semi-log graphs
An exponential model becomes linear when you take the logarithm of the output while leaving the input unchanged.
For , take and . The input may be negative, zero or positive; only is being logged. The log laws give
Now compare with using , rather than .
Semi-log graph
A semi-log graph plots vertically against horizontally. For ,
The gradient is ; the vertical intercept is . Recover by taking the antilogarithm of the gradient. This transformation is not listed as a formula in the booklet.
[DIAGRAM: asset_name: Exponential growth and decay on semi-log axes; asset_slug: exponential-log-lines; caption: Reciprocal exponential bases give opposite gradients on semi-log axes.; description: Two panels show y equals four times two to x and y equals four times one half to x on ordinary axes, then their straight lines on log base ten y against x axes. Both transformed lines have intercept log four. Their gradients are log two and negative log two.]
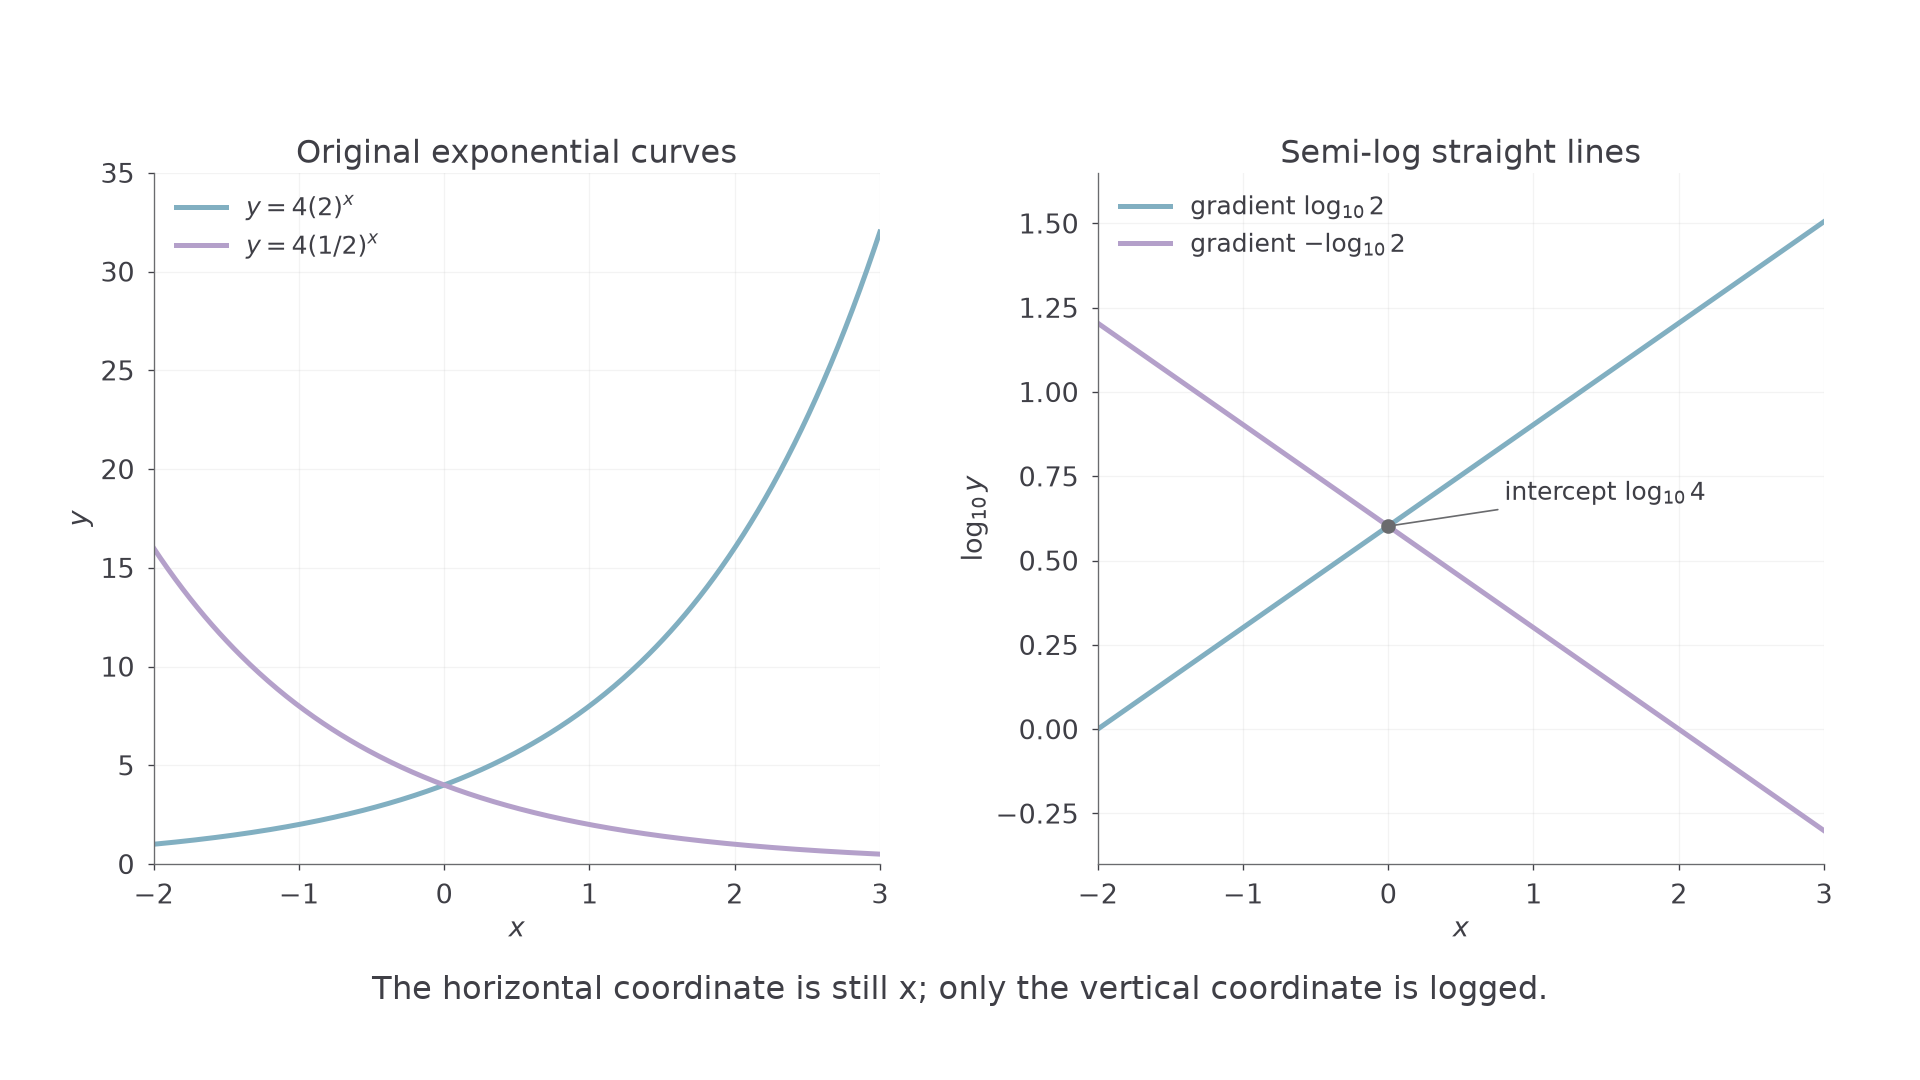
When , , giving growth. When , the gradient is negative, giving decay. If , the model is the constant .
Worked example 3: exponential growth
Write the straight-line equation for when is plotted against .
Plan. Bring down the exponent , leaving as its coefficient.
Answer. Gradient , intercept .
Check. At , ; its logarithm is the vertical intercept.
Continue this lesson.
You’re previewing NovaLearn without an account. Create a free account to read the rest.
Create free account