S1 4.1, S1 4.2 - Regression and prediction
Use the scatter diagrams and least-squares regression of S1 4.1 to summarise paired data. Apply S1 4.2 to choose the prediction direction, undo coding and interpret predictions within the model's limits.
Scatter diagrams
Can one straight line give a useful prediction when the observations do not lie exactly on it? A scatter diagram first shows whether a straight-line model is sensible.
Scatter diagram
A scatter diagram plots one point for each pair of measurements from the same individual or occasion. A point keeps those two measurements together; sorting the two columns separately would destroy the pairing.
For the pairs , choose labelled numerical axes and plot all five points. For example, is three units across and five units up. Use a consistent scale on each axis, although the two axes may use different scales.
The points tend upwards from left to right and cluster around a straight line, so a positive linear relationship is plausible. Describe both the direction and the shape: a downward pattern can be linear too. A curved pattern needs care even when the overall direction is clear. Look for unusual points because a single remote observation can strongly affect a fitted line.
[DIAGRAM: asset_name: A fitted regression line and its residuals; asset_slug: regression-line-and-residuals; caption: Least squares fits vertical discrepancies for a response y; the fitted line passes through the pair of means.; description: Scatter points one-two, two-three, three-five, four-four and five-six. The fitted line is y equals one point three plus zero point nine x, drawn over the observed x range one to five. Vertical segments show residuals and the mean point three-four is marked.]
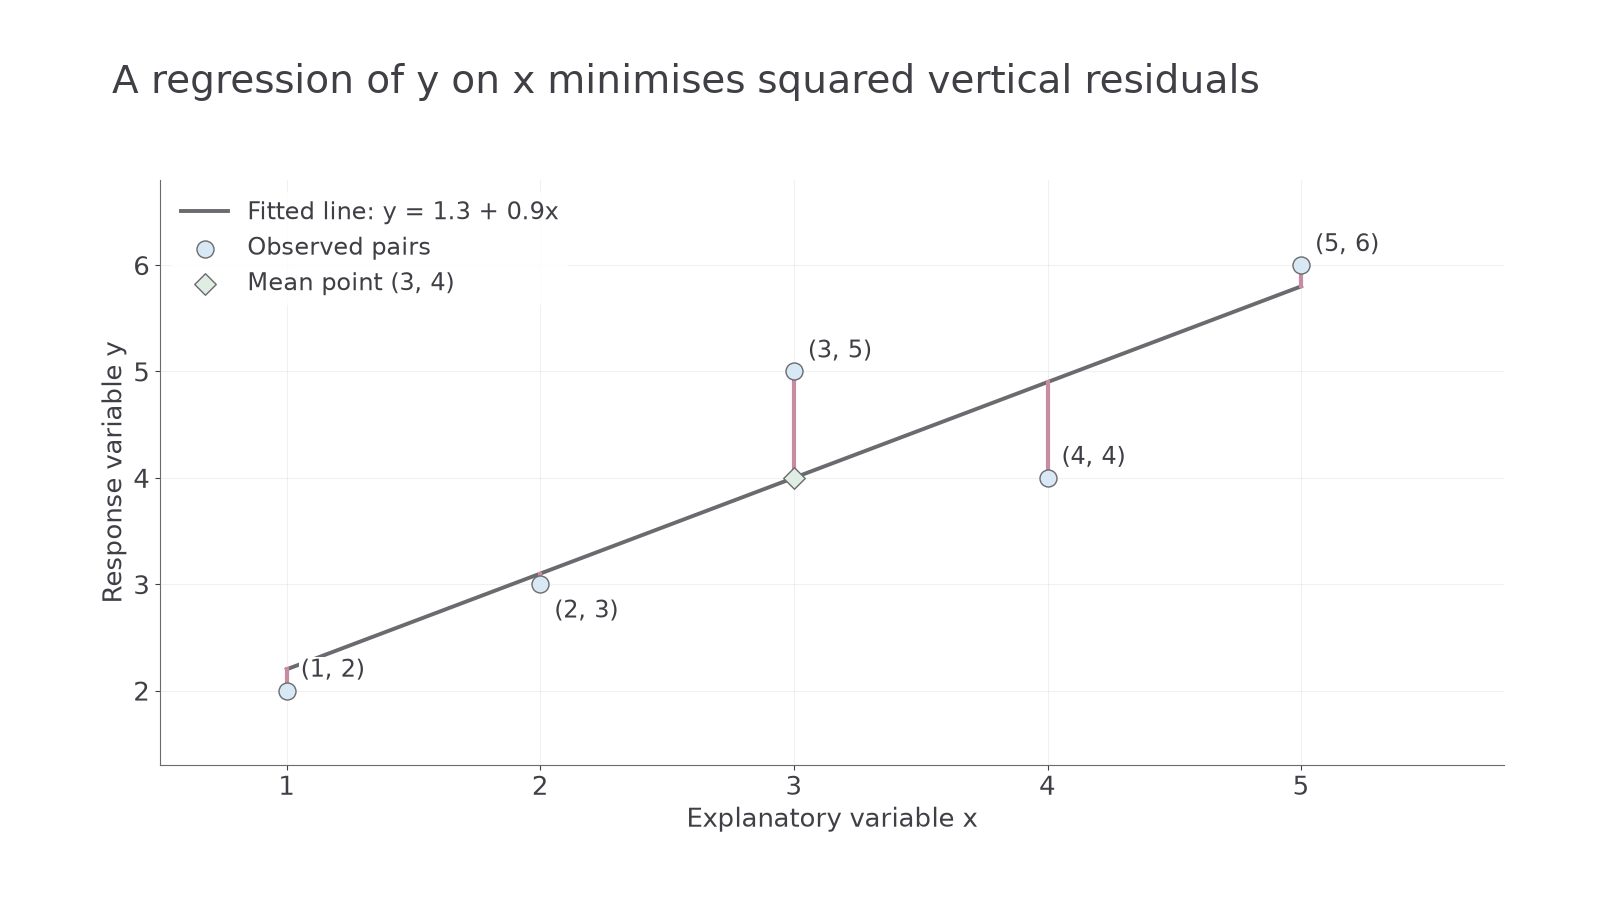
The line in the diagram is calculated from all five pairs, rather than obtained by joining the first and last points. Its calculation is taught in Part 3.
Explanatory and response variables
Before fitting a line, decide which measured quantity will be used to predict the other.
Explanatory and response variables
The explanatory variable is the input used to explain or predict another quantity. The response variable is the quantity being predicted. They are also called the independent and dependent variables in regression; those names do not assert independence of probability events.
If study time is used to predict a quiz score , fit the regression of on . Put horizontally and vertically. An equation predicts an increase of score points per extra hour of study, on average under the model. It does not say every student gains exactly four points or establish that changing study time causes the whole association.
The regression of on minimises the sum of squared vertical residuals, where a residual is observed response minus fitted response:
Squaring makes discrepancies in either direction contribute positively and gives larger discrepancies more weight. The regression of on instead predicts and minimises discrepancies in that response. Usually these are different lines: rearranging one equation does not calculate the other regression. No derivation of least squares is required in S1.
If the question asks for a prediction of score from time, use the score-on-time line. If time is to be predicted from score, the appropriate direction must be fitted to the data. Variable letters can be anything; read the context and the phrase “response on explanatory variable”.
Least-squares line from summaries
The line's gradient depends on how the two variables vary together relative to the spread of the explanatory variable.
Least-squares regression of y on x
For paired observations,
The least-squares line is
provided . These formulae are printed on page 15 of the S1 formula booklet. The sum means add each paired product, not multiply the two totals.
The equivalent form shows that the line passes through . If every explanatory value is the same, and these data cannot determine a regression gradient. Retain working precision until the final equation.
Worked example 1
Five pairs have , , , , . Calculate the regression line of y on x.
Plan. Find the means and centred sums, divide by the explanatory sum , then calculate the intercept.
Answer. .
Check. The original pairs in Part 1 have vertical residuals . They sum to zero, and their x-weighted sum is also zero, consistent with a least-squares fit. At , the line gives .
Continue this lesson.
You’re previewing NovaLearn without an account. Create a free account to read the rest.
Create free account