D1 4.4 - Float and scheduling
A project's minimum completion time also has to fit the workers available. Calculate total float, represent activity windows on a Gantt chart, and construct schedules that respect both precedence and resource limits.
Total float from event times
Can two workers finish a project in ten days when its activities require only nineteen worker-days? The arithmetic suggests they might, but some of that capacity may be available at the wrong time.
We will use this project. Each activity needs one worker for its whole duration, activities cannot be interrupted, and a successor starts only after all its immediate predecessors finish. Times are measured continuously in days from time zero.
| Activity | Duration | Immediate predecessors |
|---|---|---|
| A | 3 | None |
| B | 4 | None |
| C | 5 | A |
| D | 2 | A |
| E | 3 | B |
| F | 2 | C, D, E |
An activity-on-arc representation uses , , , , , a dummy , and . The dummy makes F wait for D as well as C and E.
[DIAGRAM: asset_name: Scheduling project and event times; asset_slug: scheduling-event-network; caption: The critical chain A, C, F fixes completion at day 10.; description: Six-event activity-on-arc network showing A3 B4 C5 D2 E3 F2 and a zero-duration dummy from4 to5, with earliest and latest event times0/0,3/3,4/5,5/8,8/8,10/10.]
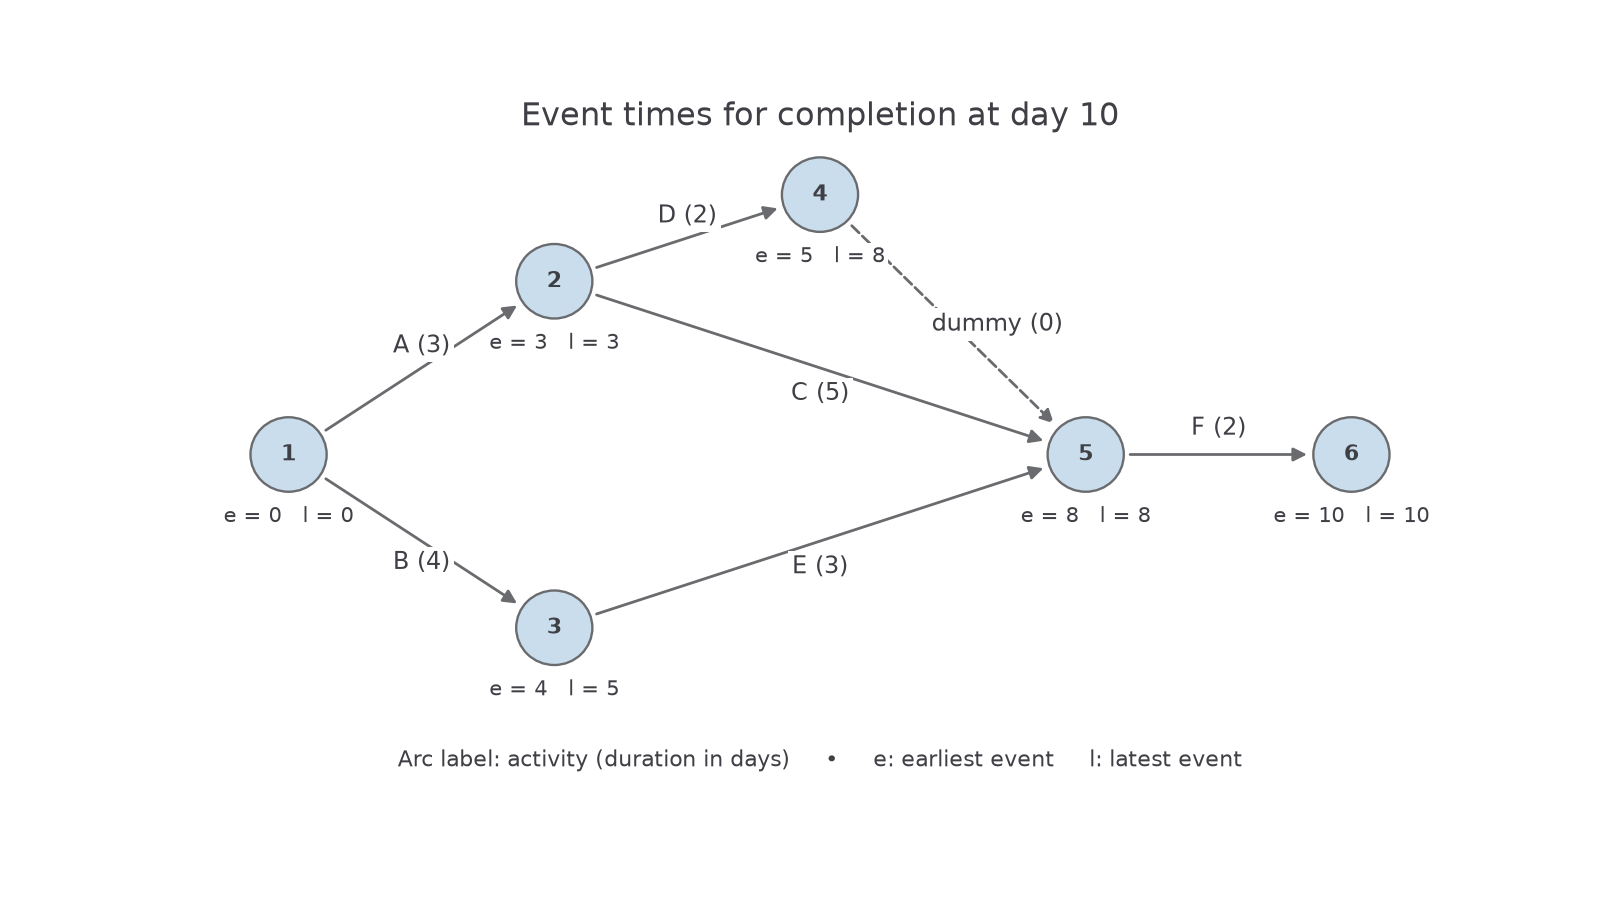
The forward and backward passes give the following times for completion at day .
| Event | 1 | 2 | 3 | 4 | 5 | 6 |
|---|---|---|---|---|---|---|
| Earliest, | 0 | 3 | 4 | 5 | 8 | 10 |
| Latest, | 0 | 3 | 5 | 8 | 8 | 10 |
For D, the earliest start is and the latest finish is . Its two days of work fit in a five-day window, leaving three days of total float.
Total float
For an activity of duration ,
Total float is the maximum amount by which the activity's start can move from its earliest start without delaying the project, provided the other activities are scheduled compatibly. Critical activities have zero total float. Not in the formula booklet: learn it.
Worked example 1: a flexible activity
Find D's total float and latest start.
Plan. Use the earliest time at its start event and latest time at its finish event.
Answer. D has days' float and can start as late as day .
Check. The earliest interval and latest interval both have length ; their starts differ by . D then finishes in time for F.
Change only the activity, from D to C. The event-time subtraction must include the new duration.
Worked example 2: a critical activity
Find C's total float and latest start.
Plan. C runs from event to event , with duration .
Answer. Zero float; C must start at day for completion at day .
Check. A, C, F take days. Any delay to C lengthens this chain, agreeing with its critical status.
The other real-activity floats are . B and E are on the same branch: delaying B by one day forces E to start a day later and uses that branch's spare day. Their floats cannot simply be added to obtain two days of project delay.
Gantt charts
A Gantt chart, also called a cascade chart, places each activity on its own row against one common time axis.
Draw the activity's working bar from its earliest start to its earliest finish. Extend a differently shaded or hatched float region from that finish to its latest finish. The combined length is its available time window, not its working duration. Critical activities have no float extension. A dummy uses no worker and needs no positive-length working bar.
[DIAGRAM: asset_name: Gantt chart with total float; asset_slug: scheduling-gantt-windows; caption: Solid bars show earliest work; hatched extensions show total float, not extra work.; description: A to F in separate rows on a day0 to10 axis. Solid intervals A0–3 B0–4 C3–8 D3–5 E4–7 F8–10. Hatched float intervals B4–5 D5–8 E7–8. A C F have zero float.]
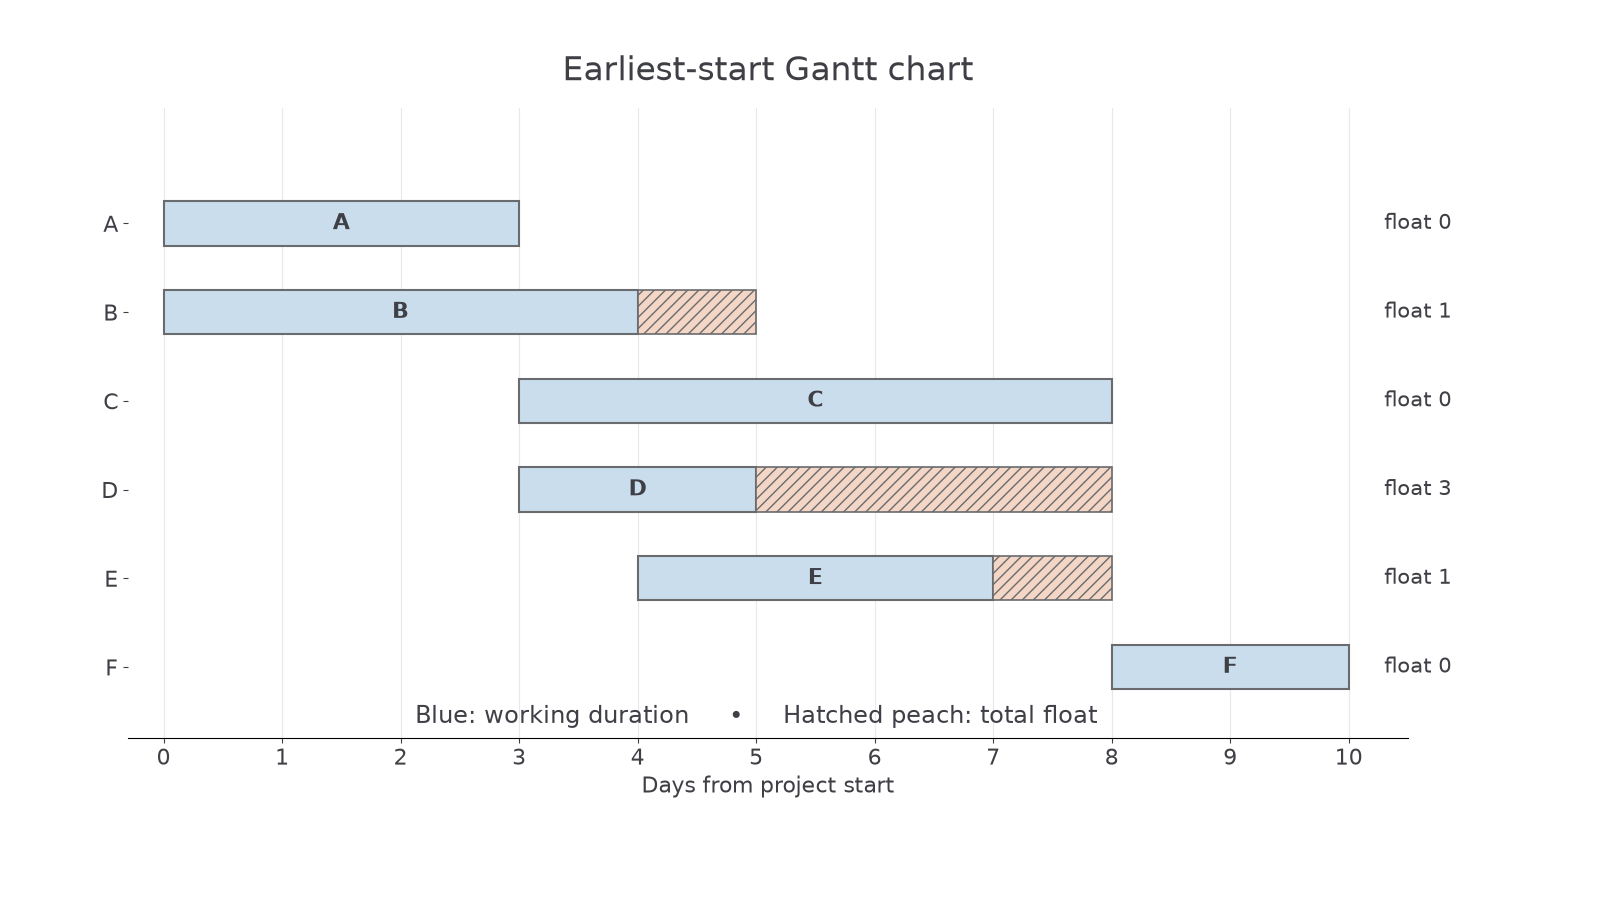
A chart showing earliest bars and float shows available windows. A worker schedule instead allocates actual work to particular workers, often moving bars inside those windows. These are different diagrams.
Worked example 3: placing a noncritical bar
For D, mark the work and float intervals on an earliest-start Gantt chart.
Plan. Find ES, EF and LF; use different shading for work and float.
Answer. Solid work from to ; float extension from to , on D's row.
Check. Solid length equals the duration. Extension length equals D's total float. If D starts at its latest start, the solid bar moves to ; the activity never takes five days.
Change only the activity to E. Its smaller float leaves less freedom to move.
Worked example 4: a shorter float extension
Place E on the same earliest-start Gantt chart.
Plan. Use E's earliest start , duration and latest finish .
Answer. Solid work from to ; float from to .
Check. The latest work interval is . If B is delayed to , E can use this latest interval, respecting their dependency.
Watch out
An activity row ending at its latest finish does not mean it works throughout the whole window. Count workers from actual work bars, not from hatched float. Conversely, an overlap of earliest-start bars alone does not prove the same overlap is unavoidable in every schedule.
Use clear activity labels, a consistent scale and a visible distinction between work and float.
Resource scheduling
Resource scheduling assigns each actual activity to an available worker while keeping its precedence restrictions.
Continue this lesson.
You’re previewing NovaLearn without an account. Create a free account to read the rest.
Create free account