6.5.2 - Gamma cameras, PET and medical tracers
Medical tracers let doctors use nuclear physics to study how living tissue is working. In this lesson you will meet the two OCR tracer examples, follow the signal through a gamma camera, then see how PET turns positron-electron annihilation into a three-dimensional image. The important contrast is simple but powerful: these methods map tracer uptake and function, not just the outline of an organ.
Medical tracers
A medical tracer is a radioactive isotope attached to, or incorporated into, a substance that the body will take up in a useful way. The tracer is introduced into the patient, for example by injection or swallowing, and its radiation is detected from outside the body.
Medical Tracer
A medical tracer is a radioactive substance used inside the body so that the distribution or movement of the substance can be detected for diagnosis.
The isotope is not chosen just because it is radioactive. It must give a useful signal while keeping the absorbed radiation dose as low as reasonably possible.
A good diagnostic tracer should:
- emit radiation that can escape the body and be detected;
- have a half-life long enough for preparation, transport and scanning;
- have a half-life short enough that the patient is not radioactive for unnecessarily long;
- be chemically suitable for the organ or process being investigated;
- be given with enough activity for a clear image, but not more than is needed.
Technetium-99m and fluorine-18 are the two examples named in the OCR specification.
Technetium-99m is used with a gamma camera. It is a metastable nuclear state, so the means the nucleus is in a relatively long-lived excited state. It emits gamma photons and has a half-life of about 6 h, which is long enough for a scan but short enough to limit prolonged exposure.
Fluorine-18 is used in PET scanning, commonly in FDG, a glucose-like tracer. Fluorine-18 is a beta-plus emitter: it emits a positron. The positron does not leave the body to be detected directly; it soon meets an electron and annihilates, producing gamma photons that the PET scanner detects.
Fluorine-18 emits positrons. The gamma photons detected by PET arise later when these positrons annihilate with electrons.
Worked example: after two half-lives, what fraction of an injected tracer remains undecayed?
After one half-life, the undecayed fraction is . After a second half-life, half of that remains:
So 25% remains undecayed. For technetium-99m, two half-lives is about 12 h. For fluorine-18, two half-lives is about 220 min, or about 3.7 h. That is why the isotope supply and timing of the scan matter.
Gamma camera image formation
A gamma camera detects gamma photons emitted by a tracer inside the patient. Its components are a collimator, scintillator, photomultiplier tubes, computer and display.
[DIAGRAM: asset_name: 6.5.2 - Gamma cameras, PET and medical tracers - diagram 1; asset_slug: 6_05_2_gamma_camera_pet_and_medical_tracers__diagram_01; recommended_method: drawn_physics; description: Accepted gamma ray travels through a lead hole; oblique ray ends inside septum; scintillation light branches to PMTs then electrical/computer stages.; caption: A gamma camera selects photon directions, converts gamma energy to light and uses electrical pulses to map tracer uptake.]
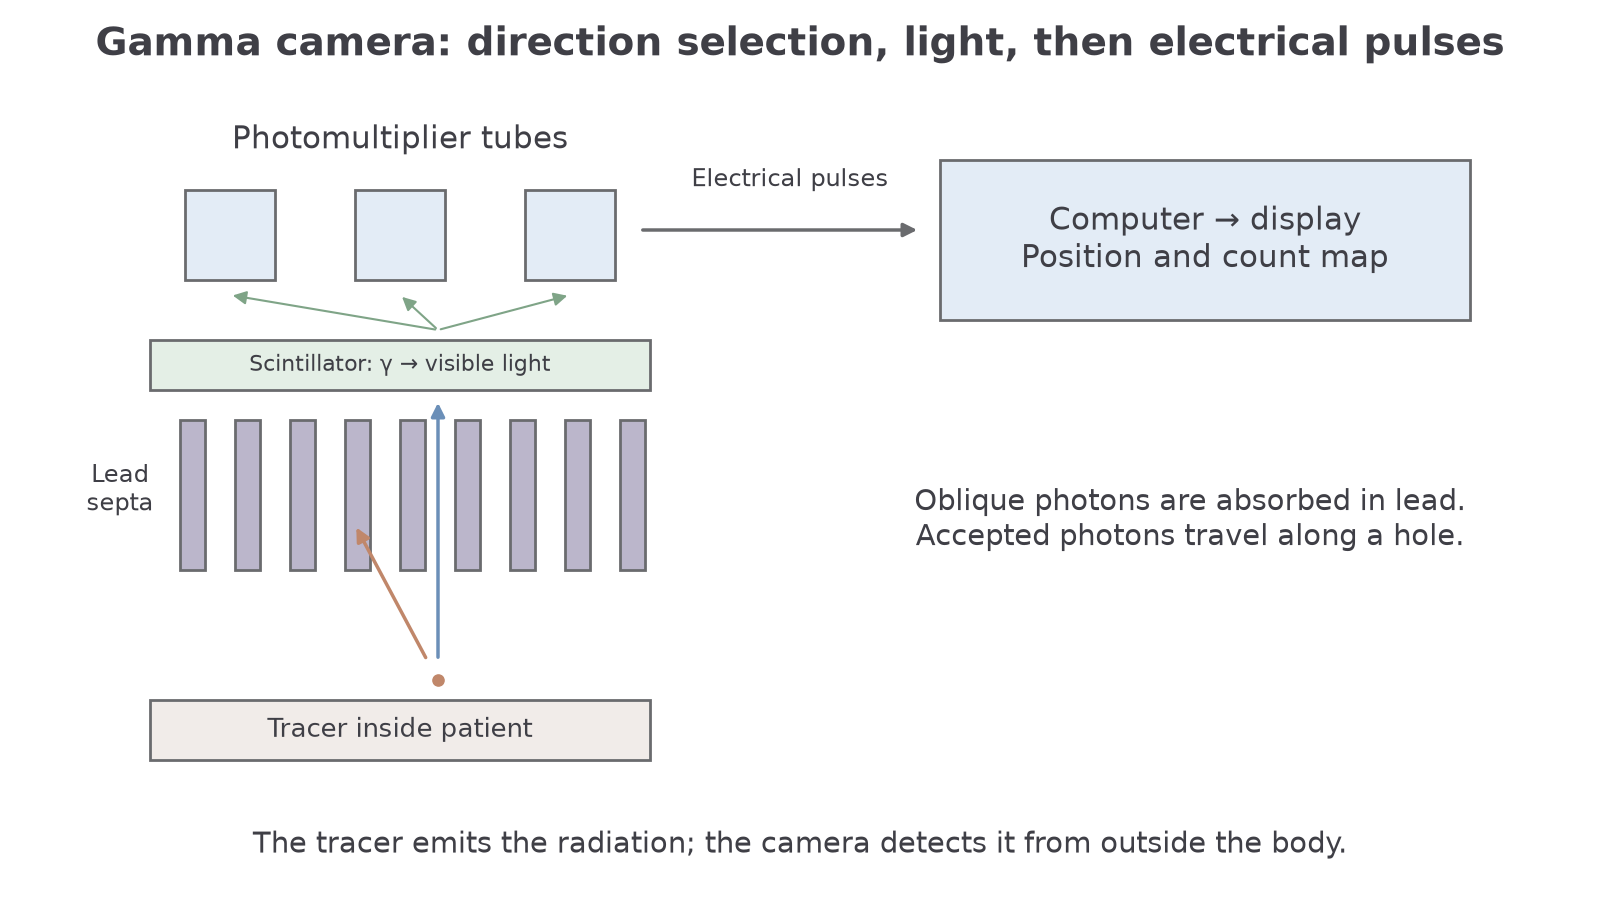
The signal chain is:
- The tracer emits gamma photons in many directions.
- The lead collimator has many long, narrow holes. It absorbs photons travelling at the wrong angle and allows photons travelling approximately along a hole axis to reach the scintillator.
- The scintillator crystal converts the energy of each accepted gamma photon into a small flash of visible light.
- Photomultiplier tubes convert the light flash into an electrical pulse and amplify it.
- The computer uses the pulse signals from the photomultiplier array to estimate where the gamma photon hit the crystal.
- The display shows a count-rate or intensity map of tracer concentration.
Collimator
A collimator is an absorbing structure with narrow channels that selects gamma photons travelling in chosen directions before they reach the detector.
Long, narrow collimator holes improve spatial resolution because an accepted photon is more likely to have come from a position directly in front of that hole. The cost is sensitivity: many photons are rejected, so fewer counts are recorded. This is why the camera may need enough activity and enough collection time to form a clear image.
Photomultiplier tubes are included because a scintillator flash is tiny. The light releases electrons from a photocathode; these electrons are multiplied through the tube, giving a pulse large enough for electronic processing.
Worked example: a photomultiplier pulse has current for . Estimate the number of electrons in the pulse.
Use the charge-current relationship from earlier circuit physics:
Convert the data:
Then:
Each electron has charge magnitude , so:
So the pulse corresponds to about electrons.
Gamma camera diagnosis
The image from a gamma camera is a functional image. Bright regions usually correspond to high tracer concentration and therefore a high count rate. Dimmer or missing regions correspond to low tracer concentration and a lower count rate.
[DIAGRAM: asset_name: 6.5.2 - Gamma cameras, PET and medical tracers - diagram 2; asset_slug: 6_05_2_gamma_camera_pet_and_medical_tracers__diagram_02; recommended_method: drawn_physics; description: Retained conditional hot/cold uptake map; no unsupported definitive diagnosis.; caption: Hot and cold spots indicate different tracer uptake, interpreted according to the biological process the tracer follows.]
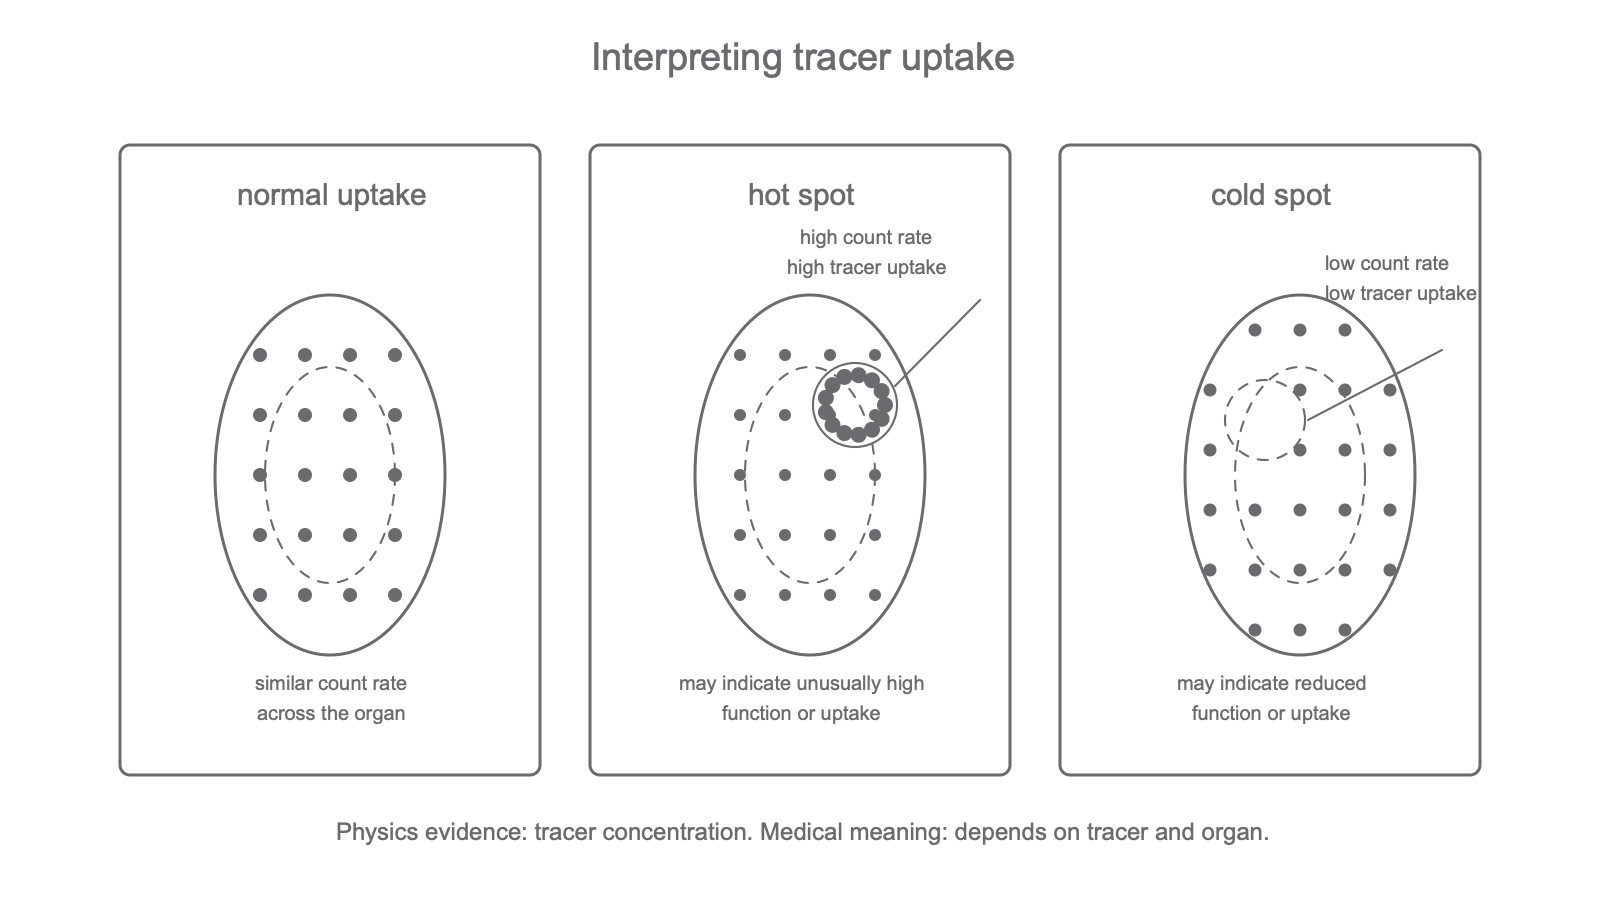
Hot Spot
A hot spot is a region on a nuclear-medicine image where tracer uptake, and therefore detected count rate, is higher than expected.
Cold Spot
A cold spot is a region where tracer uptake is lower than expected, so the detected count rate is lower than surrounding or normal tissue.
The interpretation depends on the tracer and the organ. A bone scan may show increased uptake where bone turnover is high. A thyroid scan may show areas taking up too much or too little tracer. A kidney investigation may follow how tracer is taken up and excreted. The physics conclusion is not "disease X is present"; the physics conclusion is that an abnormal distribution of tracer can give diagnostic evidence about function.
Continue this lesson.
You’re previewing NovaLearn without an account. Create a free account to read the rest.
Create free account