4.2.3 - Resistance and I-V characteristics
Resistance tells you how much potential difference is needed to drive a particular current through a component. In this lesson you will learn the recall equation for resistance, the precise condition in Ohm's law, the characteristic graph shapes for common components, and the practical method used to measure those graphs. The central skill is to connect the physics of the component to the shape of its I-V graph and to the data collected in a circuit.
Resistance and Ohm's Law
When a potential difference is applied across a component, charge carriers transfer energy as they move through it. The component's resistance is the ratio of the potential difference across it to the current through it.
Resistance
Resistance is the ratio of potential difference across a component to the current through it. The unit is the ohm, where .
Resistance
Here is resistance in ohm, is potential difference in volt, and is current in ampere. This equation is expected recall for this specification point.
There is a subtle but important distinction:
- defines the resistance at one operating point.
- Ohm's law says that the current through a conductor is directly proportional to the potential difference across it, provided physical conditions, especially temperature, remain constant.
So a component can always have a value of at a point, but it only obeys Ohm's law if stays constant as and change.
Worked example: a resistor has a potential difference of across it and a current of through it.
If this resistor is ohmic and stays at the same temperature, doubling the p.d. to doubles the current to . The resistance is still .
Ohm's law is not just the equation ; it is the constant-temperature proportionality .
Reading I-V Graphs
An I-V characteristic shows how the current through a component changes as the potential difference across it changes. The usual OCR-style graph has current on the vertical axis and potential difference on the horizontal axis.
On that graph:
For a straight line through the origin, this gradient is , which is . A steeper I-V line means a smaller resistance. This is a common trap: if a resource plots against instead, the gradient is , so always check the axes.
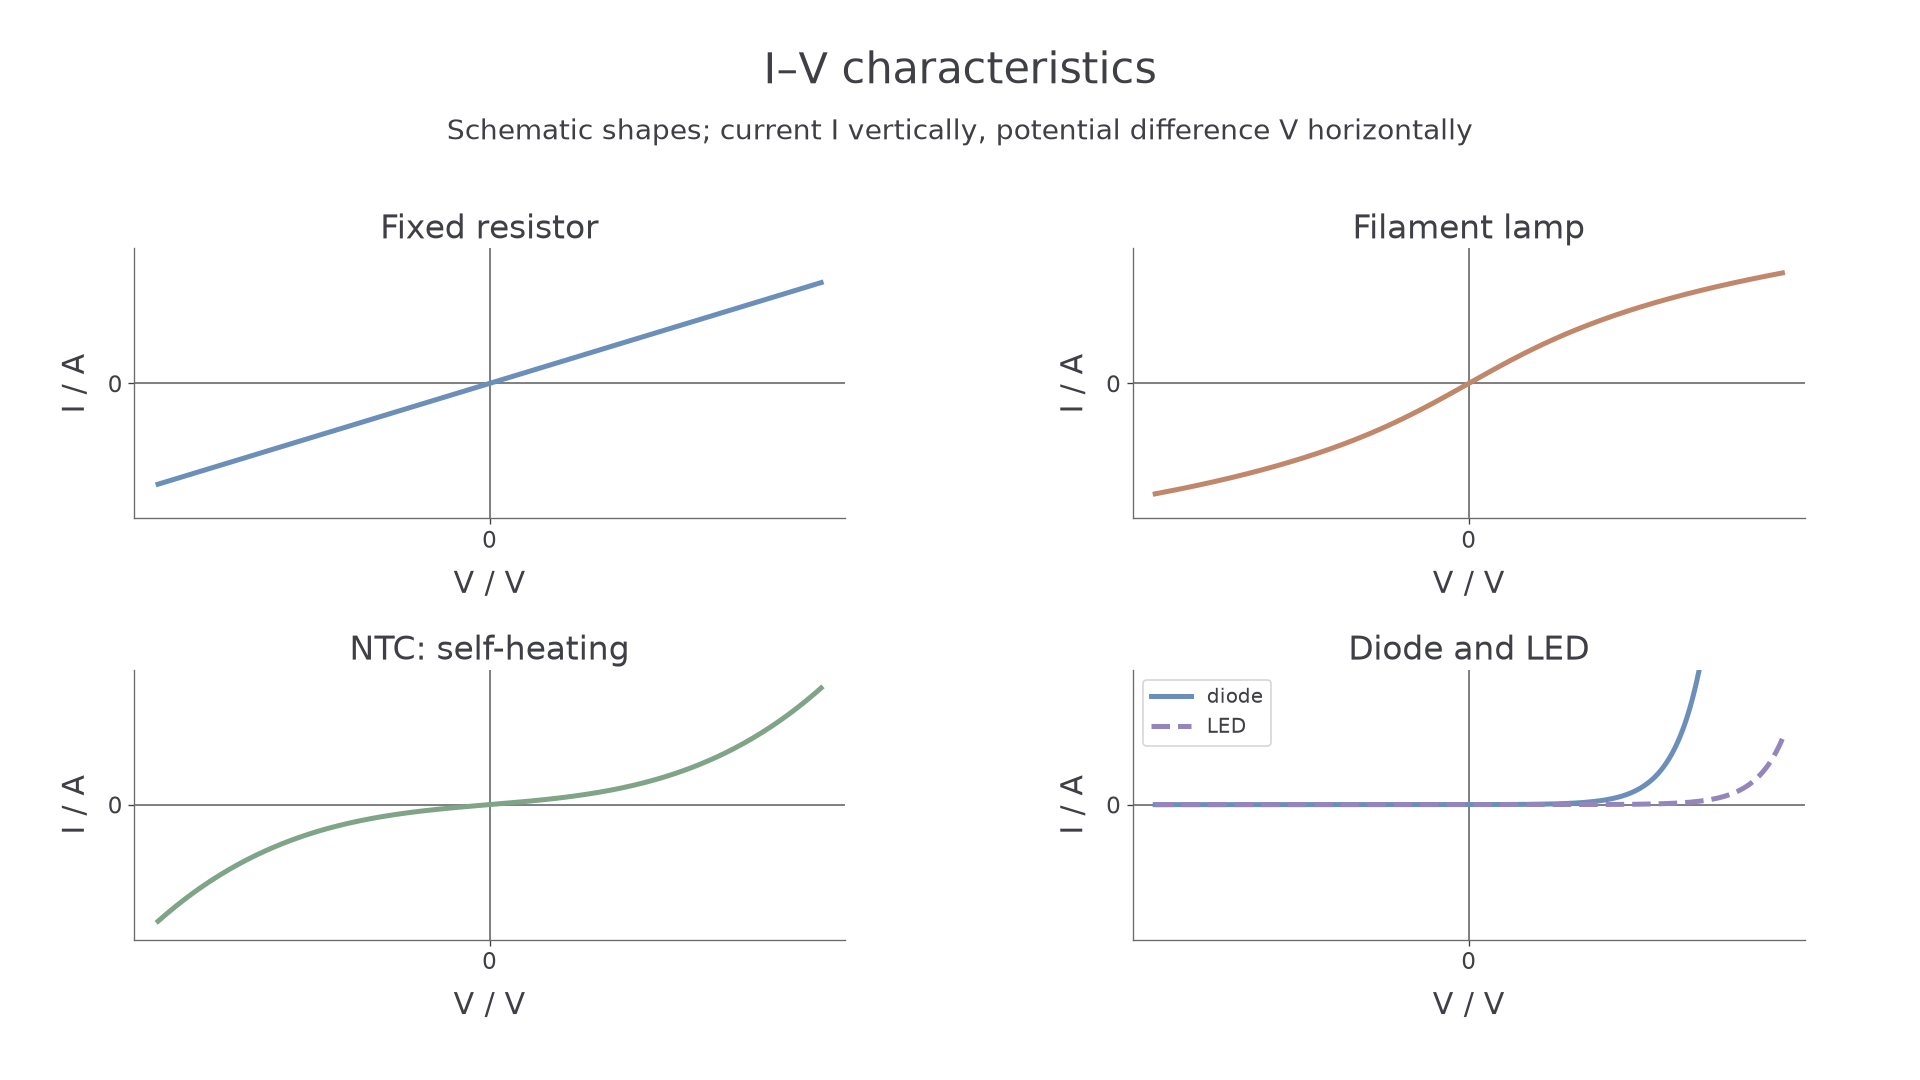
In the characteristics image, the dashed forward curve is an LED and the solid forward curve is a diode. The thermistor curve illustrates an NTC device heated by the test current. On a curved I-V graph the resistance at a point is for that point; the tangent gradient is not generally equal to .
A fixed resistor at constant temperature gives a straight line through the origin. The ratio is constant, so the resistor is ohmic.
A filament lamp is non-ohmic. As current increases, the filament heats up. Hotter metal ions vibrate more, so charge carriers collide more often and the resistance increases. On an I-V graph with on the vertical axis, the curve becomes less steep at larger p.d.
A thermistor is also non-ohmic in typical I-V measurements because its resistance depends on its temperature. If the current changes the component temperature during the measurement, the graph will not have one constant gradient. A self-heating thermistor can therefore show a curved characteristic. At a controlled, constant temperature and sufficiently small measuring current, it can instead be approximately ohmic over a suitable range.
A diode conducts mainly in one direction. In reverse bias the current is very small for normal lab voltages. In forward bias, the current stays small until the p.d. is large enough for the diode to conduct strongly. An LED behaves as a diode but emits light when forward-biased and normally needs a larger forward p.d. than a silicon diode.
These characteristics determine how components can be used. A diode can suppress current in the unwanted direction; an LED transfers some electrical energy to light, but needs a current-limiting component because a small further forward p.d. can produce a large current. Selecting a component therefore requires checking its operating current and p.d., not merely recognising its symbol.
A diode’s rapid forward-current rise is gradual: the turn-on p.d. is an approximate operating value rather than a perfectly sharp threshold. The LED curve is usually displaced to a higher forward p.d. than that of a typical silicon diode; the value depends on the device. Always limit the forward current.
[DIAGRAM: asset_slug: 4_02_3_resistance_ohms_law_and_iv_characteristics__diagram_01; description: Schematic I–V characteristics of a fixed resistor, filament lamp, self-heating NTC thermistor, diode and LED.; caption: Current–voltage characteristics of resistors, a lamp, a thermistor, a diode and an LED.]
Investigating Characteristics
The practical aim is to measure pairs of and values for the component under test, then plot the I-V characteristic. The circuit must measure the current through the component and the p.d. across the same component.
A good method is:
- Connect the component, ammeter, variable resistor, switch and low-voltage d.c. supply in series.
- Connect the voltmeter in parallel across the component under test.
- Start with a small p.d. and close the switch only while taking a reading.
- Adjust the variable resistor to obtain a range of p.d. values. Record and each time.
- Reverse the component or the supply connections to collect negative readings where the component can safely be tested both ways.
- Use a current-limiting resistor or a suitable variable resistor setting for a diode or LED, because the current can rise very rapidly in forward bias.
Continue this lesson.
You’re previewing NovaLearn without an account. Create a free account to read the rest.
Create free account