4.4.1(a)-(e) - Wave quantities, graphs and equations
Waves let energy and information travel without a material object having to travel the whole distance. In this lesson you will learn the wave language OCR expects: the difference between progressive, transverse and longitudinal waves, how to read wave quantities from graphs and oscilloscope traces, and how to use and with units that make physical sense.
Progressive Wave Model
A wave is a travelling disturbance. In a progressive wave, the disturbance moves from one place to another and transfers energy in the direction the wave travels. The particles or fields involved oscillate, but the wave pattern is what progresses.
Progressive wave
A progressive wave transfers energy from one place to another without transferring matter overall in the direction of travel.
That last phrase matters. In a water wave, a floating object bobs mostly up and down as the wave passes; it is not carried along at the same speed as the wave. In a sound wave, air molecules vibrate backwards and forwards about equilibrium positions while the pressure disturbance moves through the air.
There are two core categories in this lesson.
Transverse wave
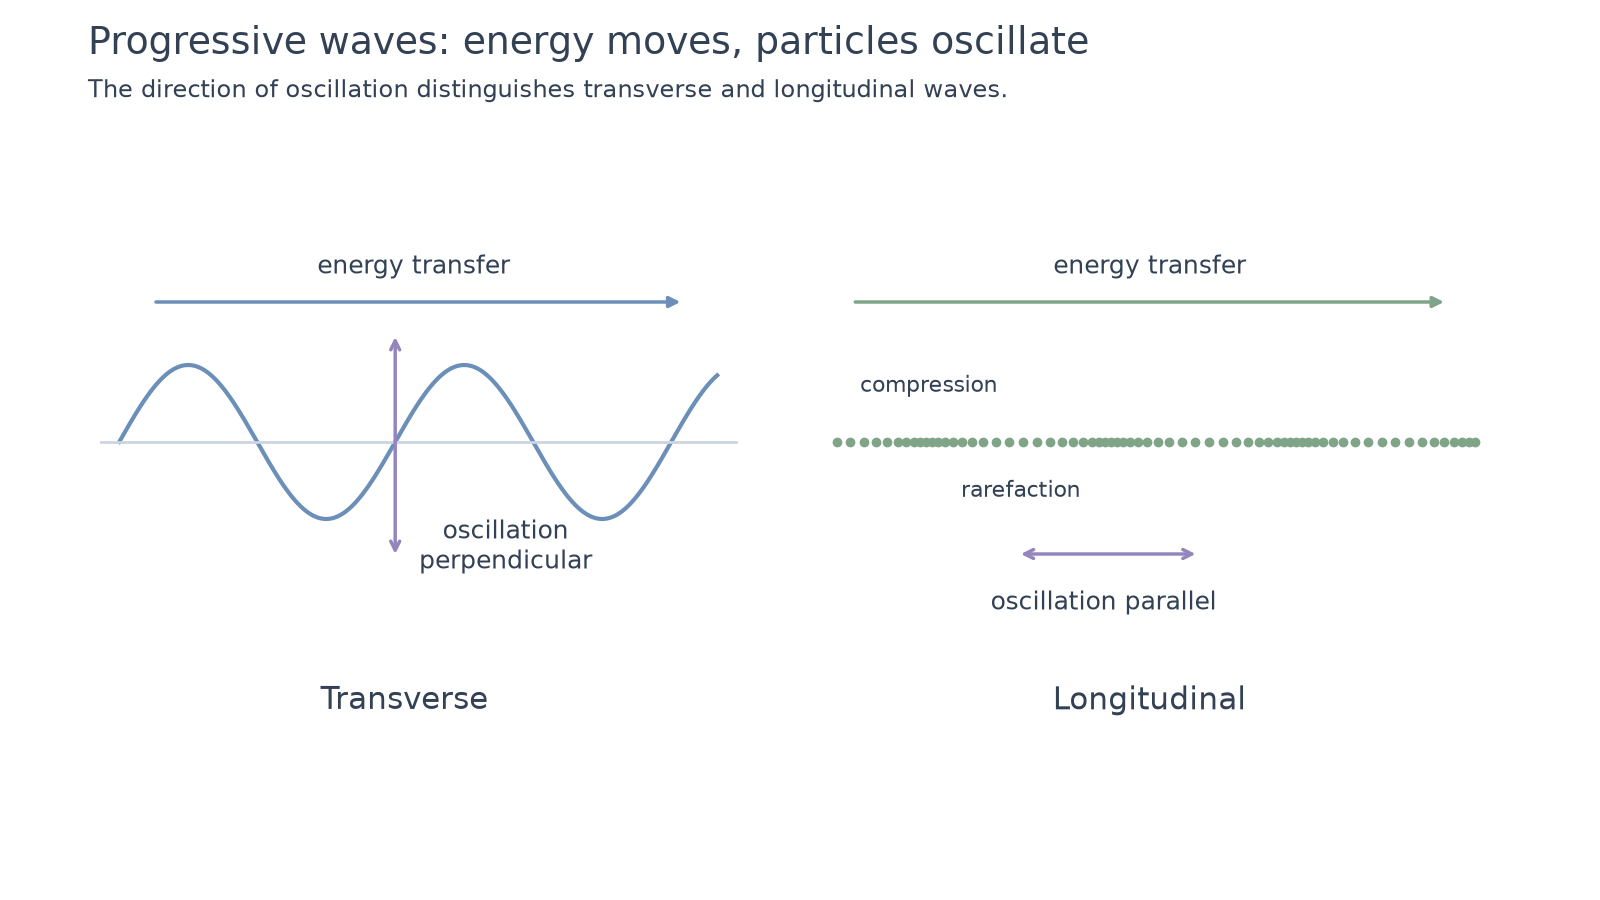
A transverse wave has oscillations perpendicular to the direction of energy transfer.
Longitudinal wave
A longitudinal wave has oscillations parallel to the direction of energy transfer. It consists of alternating compressions and rarefactions in a material medium.
For OCR wording, "direction of travel" and "direction of energy transfer" mean the same thing here. The classification depends on the direction of the oscillations, not on whether the wave happens to be drawn as a sine curve.
[DIAGRAM: asset_slug: 4_04_1a_wave_quantities_graphs_and_wave_equation__diagram_01; caption: Transverse oscillations are perpendicular to propagation. Longitudinal oscillations are parallel to propagation.; description: Transverse oscillation is perpendicular to propagation; longitudinal particles oscillate along it. Dense and sparse regions travel without carrying particles along the entire path.]
Quantities On Wave Graphs
The same wave can be represented in two common ways.
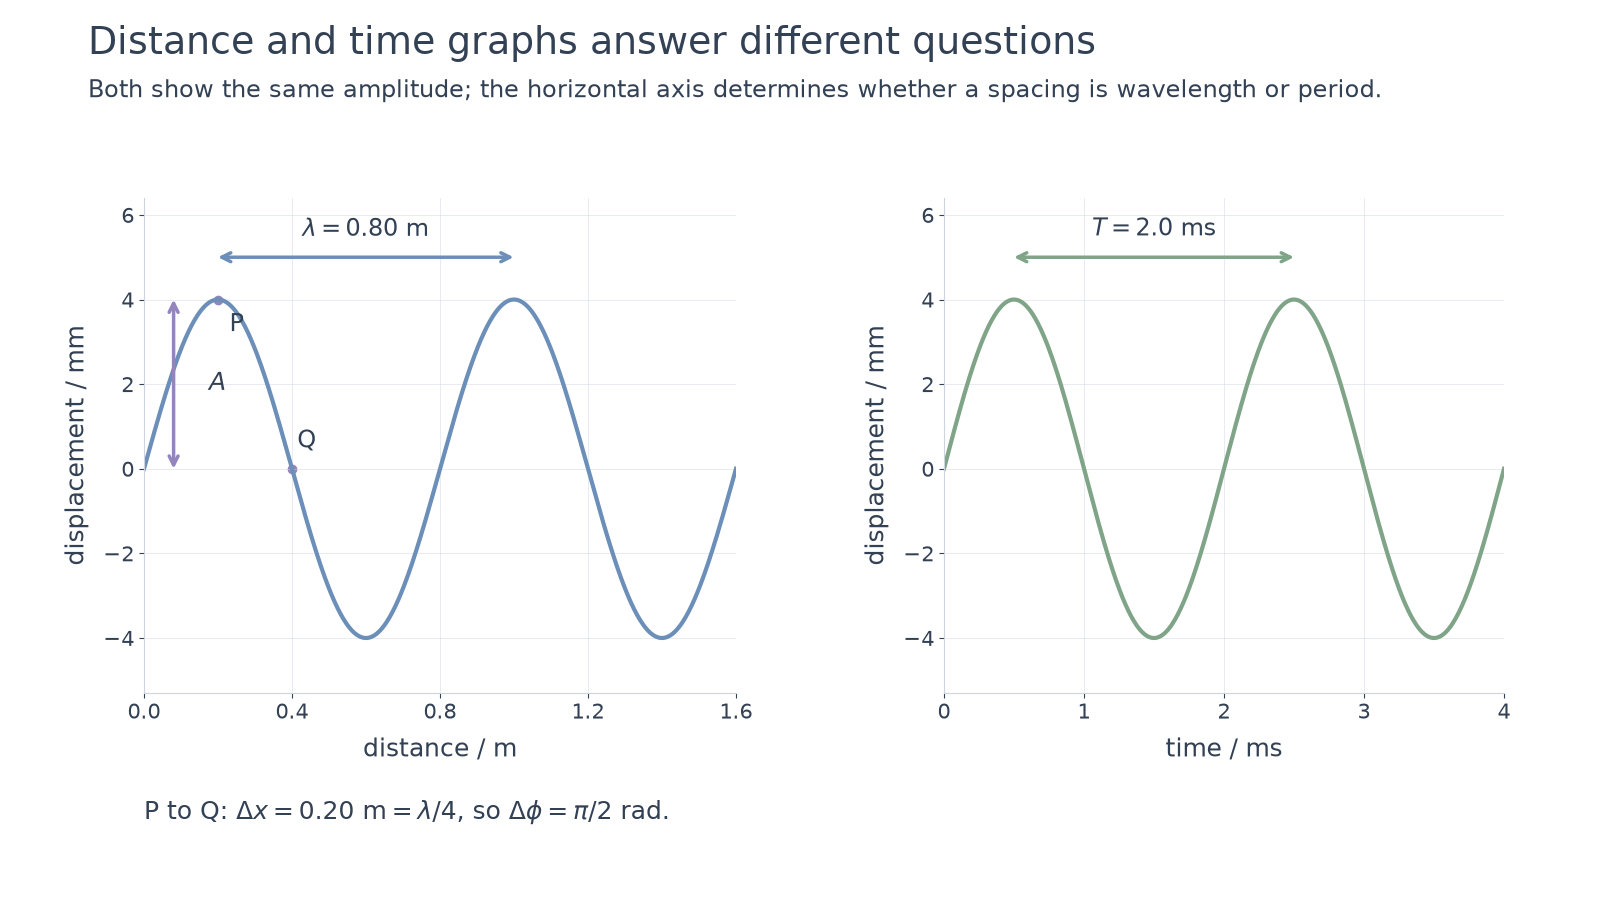
A displacement-distance graph is a snapshot: it shows the displacement of different points along the wave at one instant. A displacement-time graph follows one point: it shows how the displacement at that one position changes as time passes.
Displacement
The displacement of a point on a wave is its distance and direction from its equilibrium position at that instant. Displacement can be positive, zero or negative.
Amplitude
Amplitude is the maximum displacement of a point on the wave from its equilibrium position.
Amplitude is not the height from crest to trough. The crest-to-trough distance is . This is a common oscilloscope and graph-reading error.
Wavelength
Wavelength is the distance between adjacent points that are in phase on a wave, such as crest to crest, trough to trough, compression to compression, or rarefaction to rarefaction.
Period
The period is the time for one complete oscillation, or the time for one complete wave cycle to pass a fixed point.
Frequency
Frequency is the number of complete oscillations or wave cycles per second. Its unit is hertz, Hz, where .
Phase describes where a point is within its cycle. Two points are in phase if they are at the same stage of the cycle: for example, both at crests, or both crossing equilibrium in the same direction. A phase difference of is one complete cycle; is half a cycle; is a quarter cycle.
For two points on a displacement-distance graph at the same instant:
For the same point observed at two times:
Worked example: a displacement-distance graph shows two adjacent crests separated by . A point and a point are separated by along the wave.
The wavelength is . The separation is of a cycle, so the phase difference is:
[DIAGRAM: asset_slug: 4_04_1a_wave_quantities_graphs_and_wave_equation__diagram_02; caption: The distance graph gives a wavelength of 0.80 m and the time graph a period of 2.0 ms. Both amplitudes are 4 mm.; description: The displacement-distance snapshot gives wavelength 0.80 m; the displacement-time graph gives period 2.0 ms. Both amplitudes are 4 mm. P and Q are a quarter wavelength apart.]
Frequency Period And Oscilloscopes
Frequency and period are reciprocals. A high-frequency wave has a short period because each cycle takes less time.
Frequency and period
Here is frequency in hertz, Hz, and is period in seconds, s. The OCR formula booklet includes this relationship. For frequency in hertz, convert the measured time from milliseconds or microseconds to seconds. A compatible-unit route giving kilohertz directly is equally valid.
An oscilloscope displays voltage on the vertical axis and time on the horizontal axis. For a microphone signal, the voltage trace represents the pressure variations of the sound wave after the microphone has converted them into an electrical signal.
To determine frequency with an oscilloscope:
- Connect the signal to the oscilloscope input, for example from a signal generator or a microphone.
- Adjust the time-base so several complete cycles fill most of the display; use the trigger control to hold a steady trace.
- Count the horizontal divisions for one complete cycle, or for several cycles to reduce percentage uncertainty.
- Multiply the horizontal span by the time-base setting to obtain the total time . If that span contains complete cycles, calculate .
- Use .
Continue this lesson.
You’re previewing NovaLearn without an account. Create a free account to read the rest.
Create free account