3.4.2(e)-(f) - Material behaviour and deformation
Stress-strain graphs let you compare materials without being distracted by the exact size of the sample. In this lesson you will read typical stress-strain graphs for ductile, brittle and polymeric materials, then use unloading behaviour to distinguish elastic deformation from plastic deformation. The main skill is to make claims from graph evidence, not from vague words like "strong" or "stretchy".
Reading stress-strain graphs
A stress-strain graph normally has tensile stress on the vertical axis and tensile strain on the horizontal axis. Stress shows the tensile force per unit area. Strain shows the fractional extension of the sample.
The first part of many stress-strain graphs is a straight line through the origin. In that region, stress is directly proportional to strain and the material is behaving like a Hookean material. The gradient of this initial straight-line region is the Young modulus, but this lesson is mainly about using the graph shape to describe behaviour.
Important features on a stress-strain graph include:
- the initial straight-line region, if present
- the point where the graph stops being linear
- the elastic limit, beyond which unloading leaves permanent deformation
- the maximum stress reached, often the ultimate tensile strength from the previous lesson
- the fracture point, where the sample breaks
The axes matter. A steep initial gradient means a large stress produces only a small strain, so the material is stiff in its initial elastic region. It does not automatically mean the material is "stronger" or "better"; a graph could be steep but still fracture suddenly.
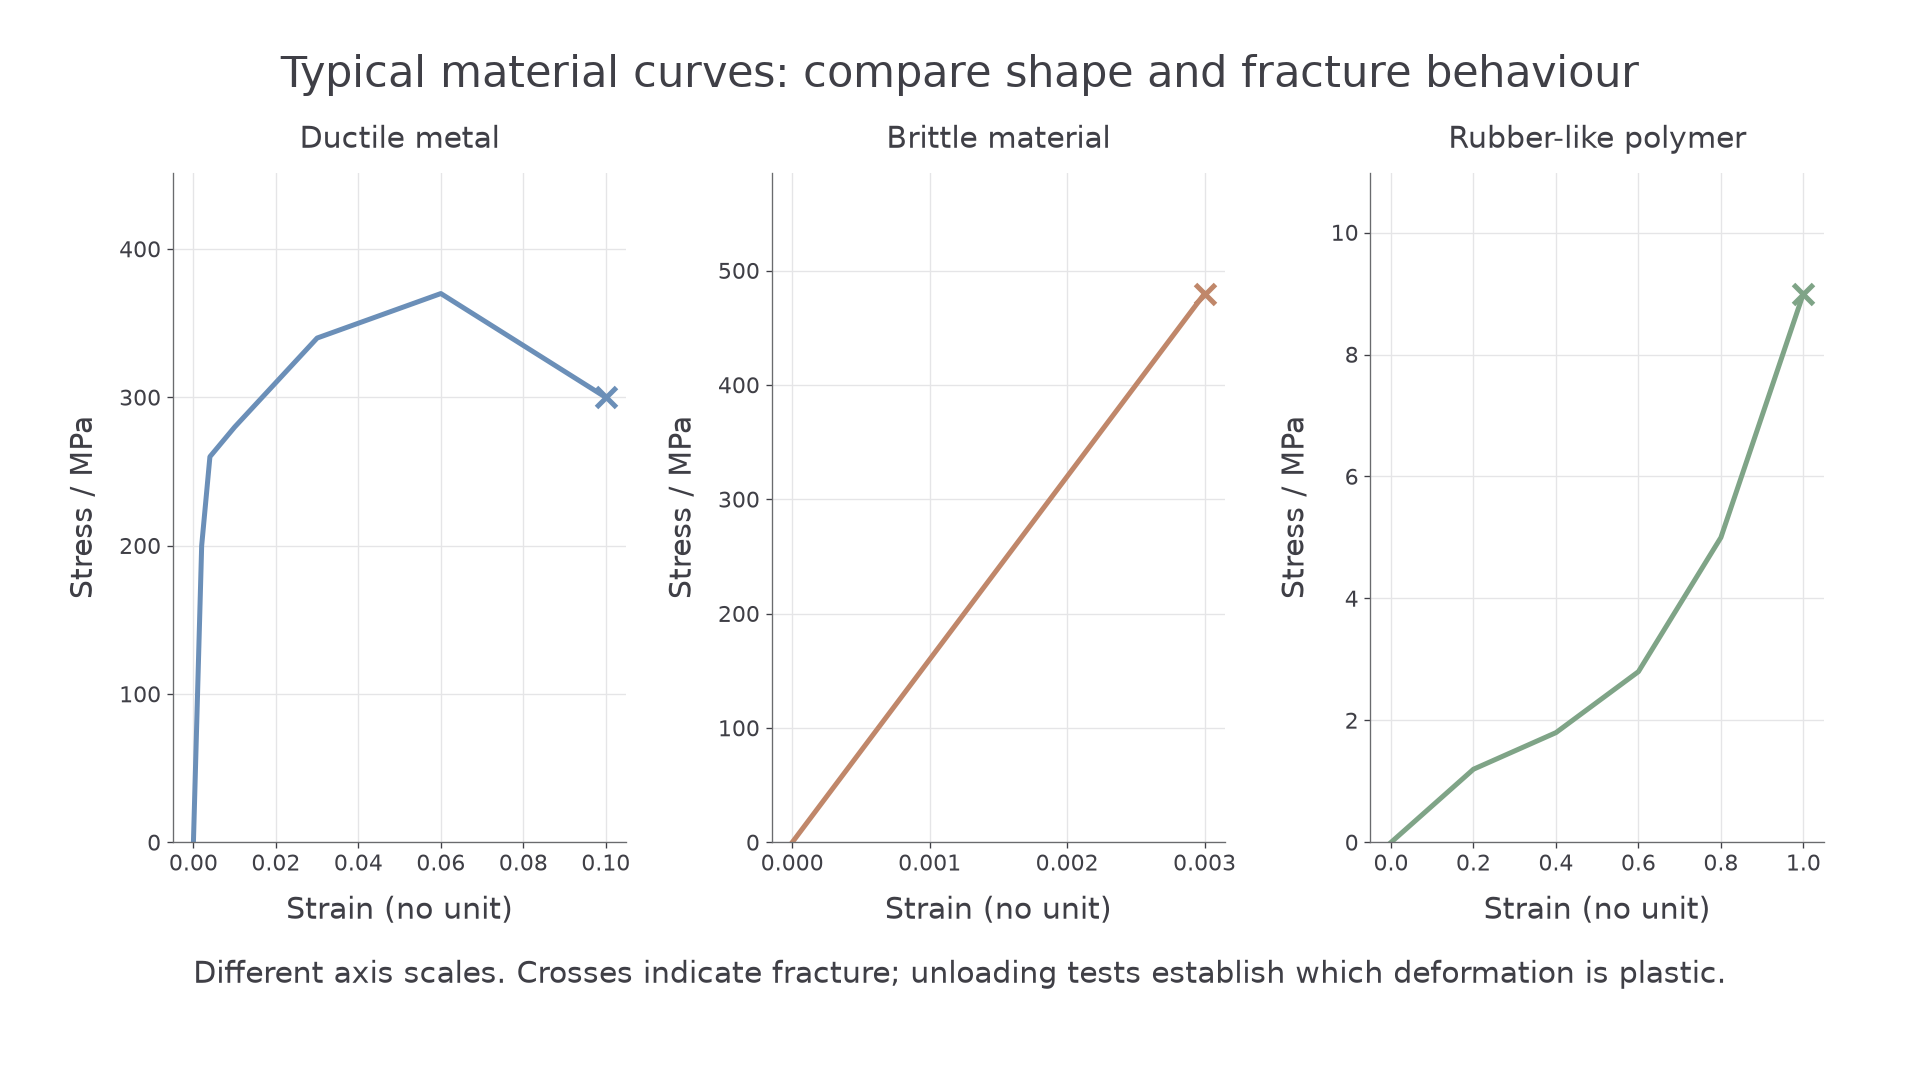
[DIAGRAM: asset_name: 3.4.2(e)-(f) - Material behaviour and deformation - diagram 1; asset_slug: 3_04_2b_material_behaviour_and_deformation__diagram_01; recommended_method: drawn_physics; caption: Stress-strain graphs compare ductile, brittle and polymeric behaviour.; description: Separate engineering stress-strain plots compare ductile, brittle and polymeric responses, with their different axis scales stated.]
Worked example: using graph features
A material has a stress-strain graph with a straight-line region from the origin up to a strain of . The graph then curves and continues to a strain of before the sample breaks. The stress reaches a maximum before the fracture point. Unloading tests beyond the initial region leave substantial permanent strain.
This is typical ductile behaviour. The evidence is that the sample has a clear initial elastic region, then a long region of confirmed plastic deformation before fracture. The maximum stress is the ultimate tensile strength, and the large strain before breaking shows that the material can deform significantly before failure.
Ductile, brittle and polymeric behaviour
A ductile material can undergo a large amount of plastic deformation before it fractures. Many metals are ductile under normal laboratory conditions.
Ductile material
A ductile material can be stretched into a new shape with significant plastic deformation before it breaks.
On a typical ductile stress-strain graph, you expect an initial straight section, then a region where the material deforms plastically. The graph may rise to a maximum stress, then fall before fracture because the sample is changing shape and narrowing. For this lesson, the important OCR-level point is the large plastic strain before breaking.
A brittle material fractures with little or no plastic deformation. Glass and ceramics are common examples, but do not define brittle as "weak". A brittle material may withstand a large stress and still fail suddenly after only a small strain.
Brittle material
A brittle material fractures with little or no plastic deformation.
On a typical brittle stress-strain graph, the curve is short in the strain direction and ends abruptly at fracture. There may be a steep initial straight region, but there is no long plastic region.
Polymeric materials can show much larger strains and more obviously non-linear behaviour. A rubber-like polymer may have a low initial gradient and then become harder to stretch as strain increases. Other polymers can be more brittle or more plastic, so "polymeric" is a material family, not one exact graph shape.
Polymeric material
A polymeric material is made from long-chain molecules. In this topic, typical polymeric stress-strain graphs are often non-linear and may show large strain before fracture.
Compare materials by giving graph evidence:
| Material behaviour | Typical graph evidence | Careful wording |
|---|---|---|
| Ductile | large strain after the elastic region before fracture | "large plastic deformation before breaking" |
| Brittle | fracture after small strain, little plastic region | "fractures suddenly with little/no plastic deformation" |
| Polymeric | non-linear curve, often large strain and changing gradient | "does not have one constant Young modulus over the full range" |
Worked example: comparing two materials
Material A reaches a high stress but fractures at a strain of . Material B reaches a lower maximum stress but continues to a strain of before fracture; unloading tests show substantial permanent strain.
Material A is behaving in a more brittle way because it breaks at a very small strain. Material B is more ductile because its large strain includes substantial plastic deformation. A large fracture strain alone would not distinguish ductility from a rubber-like material that recovers elastically. You should not say that Material A is simply "better" because it reaches the higher stress; the two materials fail in different ways.
Elastic and plastic deformation
Elastic deformation is about what happens after the load is removed. If the material returns to its original shape and size, the deformation was elastic.
Elastic deformation
Elastic deformation is deformation that is completely reversed when the deforming force is removed.
Plastic deformation is permanent. When the load is removed, the material does not return fully to its original length or shape.
Plastic deformation
Plastic deformation is deformation that is not completely reversed when the deforming force is removed, so a permanent change remains.
Do not confuse "elastic" with "straight-line graph". A material can show non-linear elastic behaviour: the graph curves, but if the load is removed the sample still returns to its original length. Hooke's law is a stricter condition than elastic behaviour.
On an unloading graph:
- if the path returns to the origin, there is no permanent strain
- if the unloading path meets the strain axis at a positive value, that intercept is the residual strain
- residual strain is evidence of plastic deformation
Worked example: residual extension after unloading
A plastic strip has original length . It is stretched by a large force and then unloaded. Its final length is .
Continue this lesson.
You’re previewing NovaLearn without an account. Create a free account to read the rest.
Create free account