6.4.3(d)-(h) - Activity, half-life, decay and dating
Radioactive decay is random for any one nucleus, but a large sample follows a very predictable pattern. In this lesson you will connect activity, decay constant, half-life and exponential decay equations, then use the same ideas in practical half-life measurement, spreadsheet models and radioactive dating. You will distinguish an unpredictable individual event from a predictable large-sample trend.
Activity and decay constant
A radioactive source contains many unstable nuclei. You cannot predict which particular nucleus will decay next, but you can predict the average rate at which a large number of nuclei decay.
Activity
The activity of a radioactive source is the rate at which nuclei decay. Its unit is the becquerel, , where .
If a sample has a large number of undecayed nuclei, the activity is higher when is larger. It is also higher for an isotope whose nuclei have a larger chance of decaying in each second. That probability per unit time is represented by the decay constant.
Decay constant
The decay constant is the probability per unit time that an undecayed nucleus will decay. If time is measured in seconds, the unit of is .
For a sample containing undecayed nuclei:
Activity and Number of Nuclei
This equation is physically sensible: doubling the number of undecayed nuclei doubles the average number of decays per second, and using an isotope with twice the decay constant also doubles the activity. Since is a positive rate of decay, the rate of change of itself is negative:
Differential Decay Equation
The minus sign means the number of undecayed nuclei is decreasing. The activity is the magnitude of that decrease: .
An amount of radioactive isotope can be converted to a number of nuclei using:
where is the amount of substance in mol and .
Worked example: a sample contains of an isotope with decay constant . Find its activity.
First convert amount of substance to number of nuclei:
Then use :
The answer is large because a becquerel is only one decay per second; many radioactive samples contain enormous numbers of nuclei.
Probability over a time interval
A probability lies between 0 (impossible) and 1 (certain). For a short interval , an undecayed nucleus has decay probability approximately , provided . The exact probability of decay during time is ; the probability of surviving is . The decay constant is a rate, so it is not itself a dimensionless probability and can exceed .
For example, with , the probability of decay in the next is , about 9.5%. A nucleus which has survived for a long time still has this same probability during its next 5.0 s; it does not become “due” to decay. In 1000 independently decaying nuclei, about 95 decays are expected in that interval, but the observed count varies.
Half-life and exponential shape
Half-life is a way of describing the same decay process without counting every nucleus. It is not the time for all the nuclei to decay. It is the time for the number of undecayed nuclei, and therefore the activity, to halve.
Half-life
The half-life of an isotope is the time taken for the number of undecayed nuclei in a sample to decrease to half its original value.
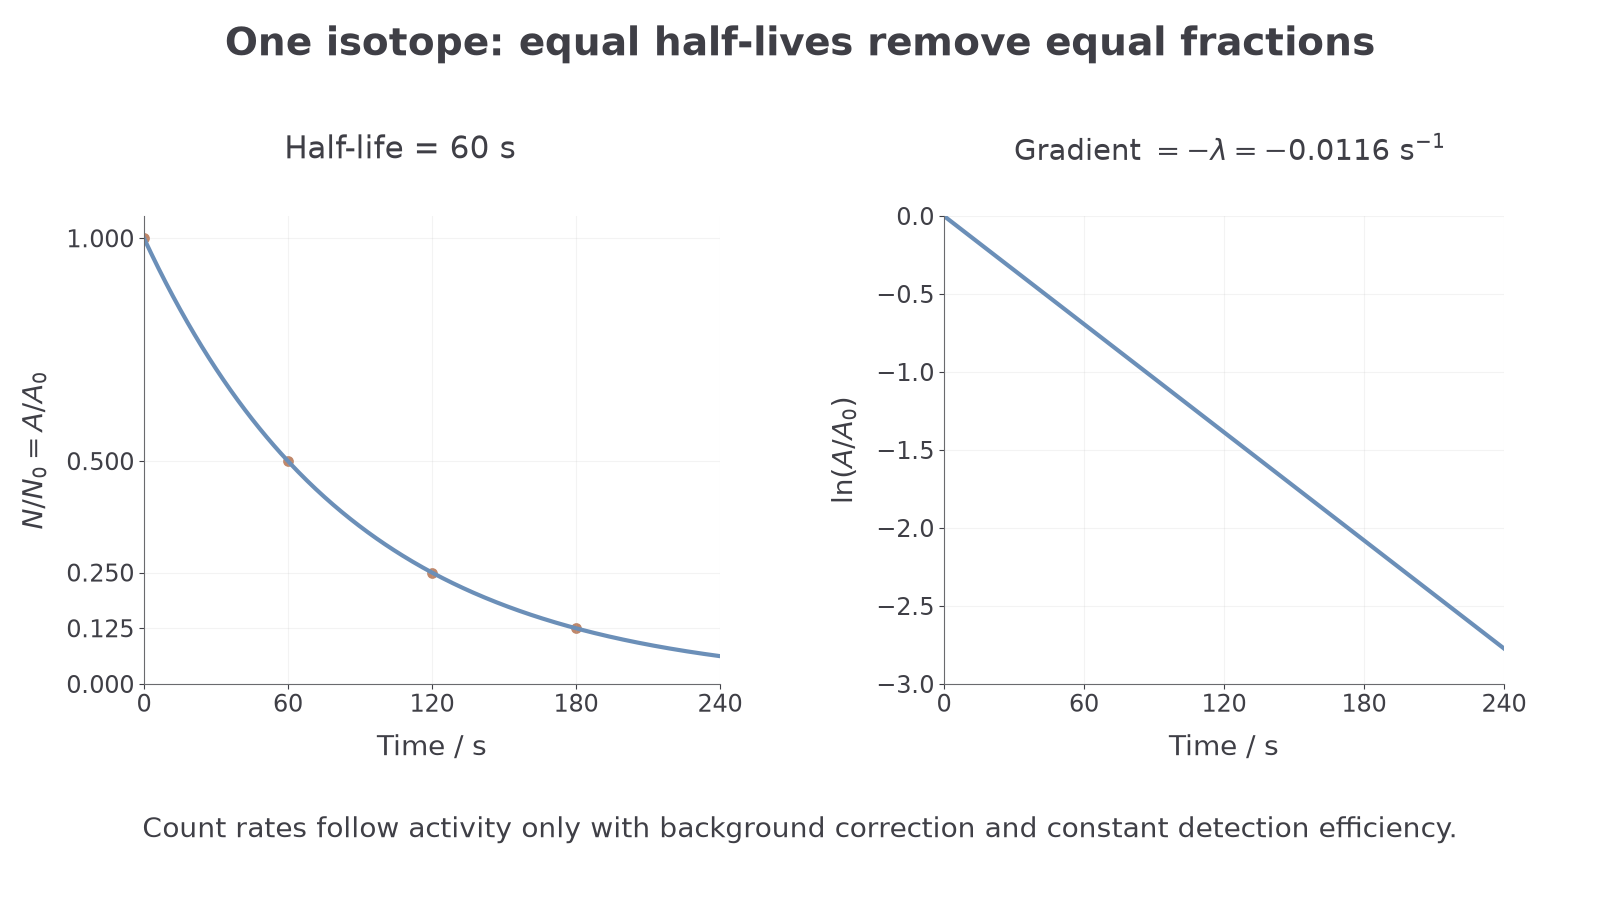
Because , activity and the number of undecayed nuclei of one isotope halve together. A measured count rate follows this pattern only after background correction and with unchanged detection efficiency and geometry. After one half-life, ; after two half-lives, ; after three, .
The relationship between half-life and decay constant is:
Half-life and Decay Constant
You can see where this comes from by using the exponential model. If half the nuclei remain:
Cancel and take natural logs:
so:
A large decay constant gives a short half-life. A small decay constant gives a long half-life. That inverse link is a common source of errors: high activity is not the same idea as long half-life.
[DIAGRAM: asset_name: 6.4.3(d)-(h) - Activity, half-life, decay and dating - diagram 1; asset_slug: 6_04_3b_activity_half_life_exponential_decay_and_dating__diagram_01; recommended_method: drawn_physics; description: Analytic exponential and ln ratio share seconds axis; half-life 60 s and gradient −0.0116 s⁻¹ agree.; caption: Exponential decay with a 60 s half-life becomes a straight line when the natural logarithm of the activity ratio is plotted.]
Using the decay equations
The same exponential form can be written for undecayed nuclei or for activity:
Exponential Decay Equations
Here and are the initial number of undecayed nuclei and initial activity. The two equations have the same shape because activity is proportional to the number of undecayed nuclei.
You can also use the half-life version:
This is often faster when the time is an exact number of half-lives. Use the natural-log version when the remaining fraction is not a simple power of a half.
Worked example 1: a medical tracer has half-life . Find the time for its activity to fall to of its initial value.
Use the activity ratio:
Find in because the answer is wanted in minutes:
Then:
Take natural logs:
The negative sign matters: is negative, and time must be positive.
Worked example 2: a pure radioactive isotope has half-life , molar mass , and initial activity . Estimate the initial mass of isotope present.
Convert the half-life to seconds:
Use :
Convert nuclei to moles and then mass:
This type of chain is why unit discipline matters. Use seconds with unless you have deliberately expressed in another time unit.
Logarithmic scales and decay plots
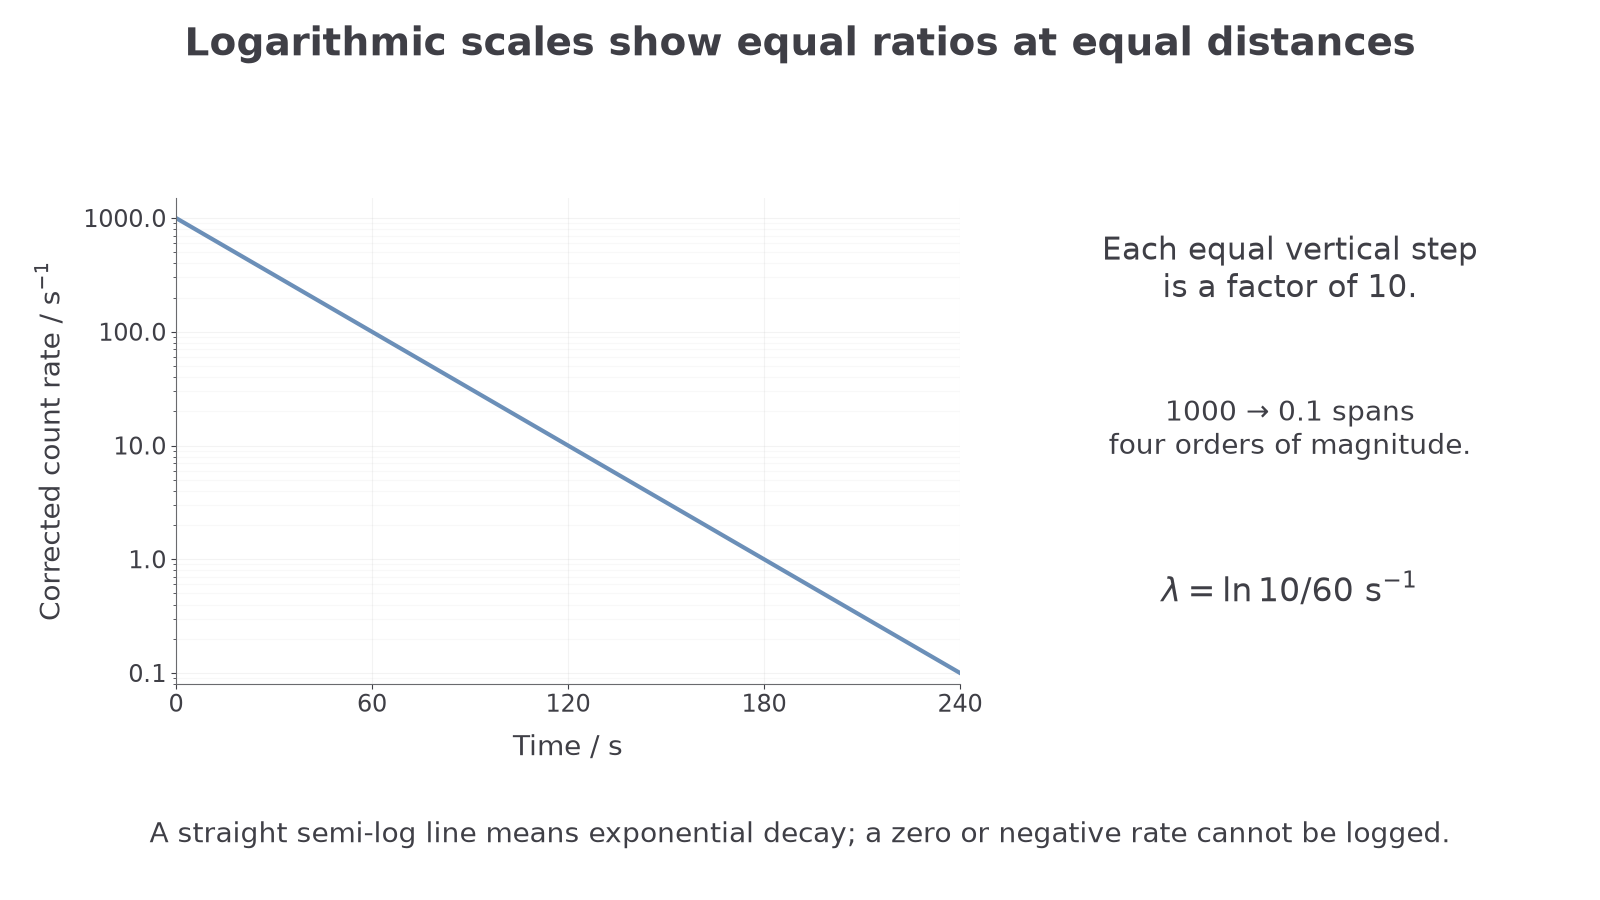
A linear vertical scale assigns equal distances to equal differences. A logarithmic scale assigns equal distances to equal ratios: marks at are equally spaced and span four orders of magnitude. This displays a large range of corrected count rates clearly. Halfway between 10 and 100 on a log scale is , not 55. Zero and negative values cannot appear on a logarithmic axis; a late background-subtracted value near zero cannot safely be logged.
Let denote background-corrected count rate. With fixed geometry, . Taking natural logarithms of a dimensionless ratio gives
A straight line of against supports an exponential model; its gradient is . If instead the plot uses , then
The base-10 gradient is , not . Read two widely separated points on the best-fit line, not just adjacent measured points.
Worked example: a semi-log plot falls from to in 120 s. This is two equal decade intervals, giving base-10 gradient . Hence and . The straight line represents equal fractional loss in equal times, even though the raw rate decreases along a curve.
[DIAGRAM: asset_name: Logarithmic scales for radioactive decay; asset_slug: 6_04_3b_logarithmic_scales__diagram_04; recommended_method: drawn_physics; description: A semi-log graph of corrected rate from 1000 to 0.1 per second over 240 s, with equal decade spacing. Each factor-of-ten decrease takes 60 s.; caption: Adjacent labelled ticks on this logarithmic count-rate axis differ by a factor of ten.]
Continue this lesson.
You’re previewing NovaLearn without an account. Create a free account to read the rest.
Create free account