5.5.1(g) - H-R diagram and stellar classification
The Hertzsprung-Russell diagram, usually called the HR diagram, is a map for classifying stars using two measured properties: luminosity and surface temperature. In this lesson you will learn how to read the axes, recognise the main sequence, and identify red giants, red supergiants and white dwarfs from their positions. The key skill is not memorising a picture; it is explaining what a position on the luminosity-temperature plot tells you.
Axes Of The HR Diagram
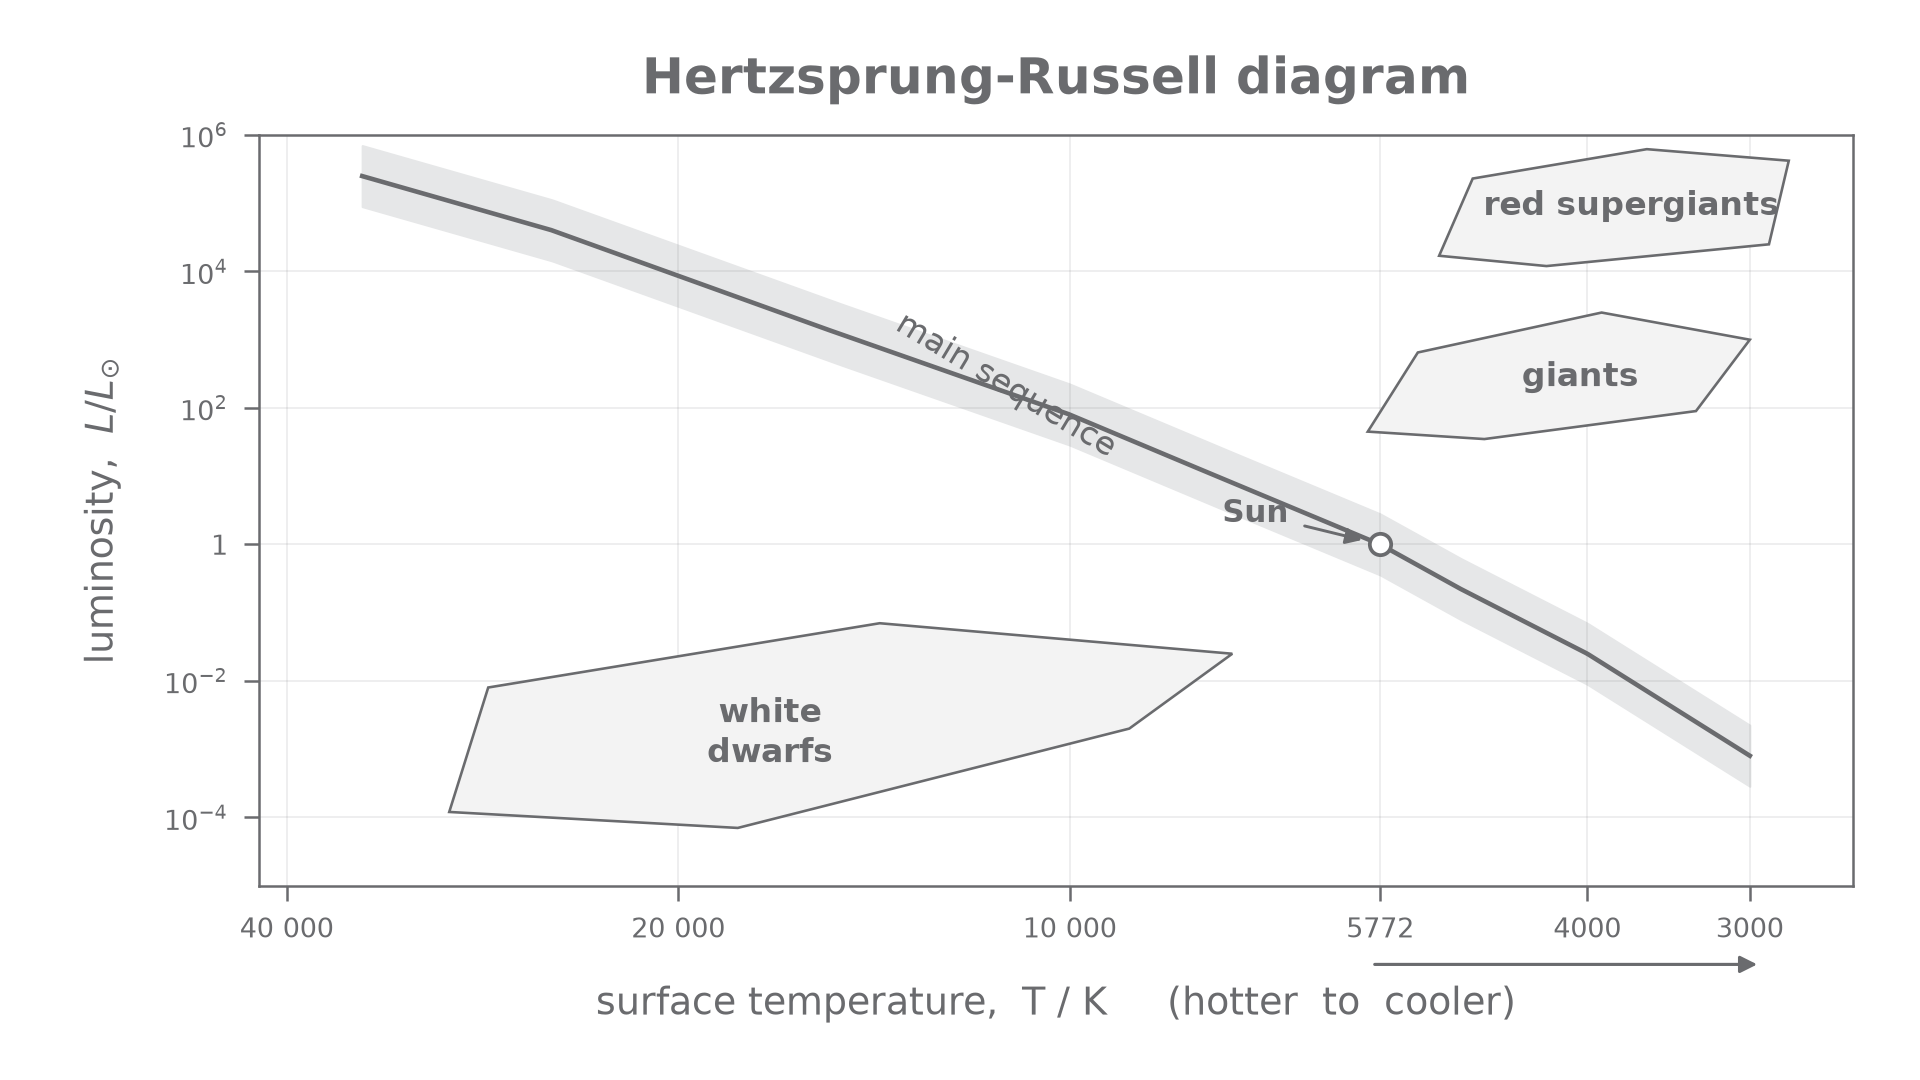
An HR diagram plots stellar luminosity against surface temperature. That makes it different from a picture of the night sky: the diagram is not showing where stars are in space.
Luminosity
Luminosity is the total energy emitted by a star per unit time. It is the star's intrinsic power output, not how bright the star happens to look from Earth.
Luminosity may be given in watts, but HR diagrams often use luminosity relative to the Sun. For example, means the star has one hundred times the Sun's luminosity.
The horizontal axis is surface temperature in kelvin. The convention that often catches students is that temperature decreases from left to right:
- hot stars are on the left
- cooler stars are on the right
The vertical axis increases upwards:
- low-luminosity stars are near the bottom
- high-luminosity stars are near the top
The luminosity axis is usually logarithmic: equal vertical steps represent equal ratios, not equal additions. A step from to is a factor of ten, just like a step from to . A vertical range on a measured point can cross more than one region; temperature alone cannot resolve that ambiguity.
When you read a point on the diagram, read both coordinates together. A star can be hot and low luminosity, or cool and high luminosity. The class depends on the combination.
[DIAGRAM: asset_slug: 5_05_1b_hr_diagram_and_stellar_classification__diagram_01; description: The H–R diagram uses logarithmic luminosity and a temperature axis decreasing to the right; both coordinates determine classification.; caption: The H–R diagram compares luminosity and temperature to identify stellar groups. Temperature decreases to the right.]
The Main Sequence Band
Most stars on an HR diagram lie in a broad diagonal band called the main sequence. It runs from the upper left to the lower right.
On the main sequence:
- stars at the upper left are hot and very luminous
- stars near the middle include stars like the Sun
- stars at the lower right are cooler and much less luminous
The main sequence is therefore not a vertical or horizontal group. It shows a trend: for main-sequence stars, higher surface temperature is associated with higher luminosity.
Main sequence
The main sequence is the diagonal band on an HR diagram containing stars that fuse hydrogen into helium in their cores and follow the main luminosity-temperature trend from hot, luminous stars to cool, dim stars.
Be careful with the phrase "red star". A cool red star can be on the lower right of the main sequence if its luminosity is low. A cool red star with high luminosity belongs in a giant or red supergiant region instead. The HR diagram separates these cases by using luminosity as well as temperature.
Worked example: classifying a main-sequence star
A star has , so it is hotter than the Sun. It also lies on the main diagonal band and has a luminosity greater than the Sun's. It should be classified as a main-sequence star, not as a white dwarf or giant, because its plotted point is on the main-sequence band.
Continue this lesson.
You’re previewing NovaLearn without an account. Create a free account to read the rest.
Create free account