5.5.2(a)-(h) - Spectra, energy levels and diffraction gratings
Spectra let astronomers turn starlight into evidence. In this lesson you will connect electron energy levels to photons, explain why atoms produce line spectra, and use a transmission diffraction grating to determine wavelengths. The same two ideas sit underneath much of stellar spectroscopy: atoms only absorb or emit particular photon energies, and gratings let those wavelengths be measured precisely.
Bound energy levels
In an isolated gas atom, an electron does not have a continuous range of possible energies. It can occupy only certain allowed energy levels. These are discrete: there are gaps between them.
The energy values are usually drawn with at the top. That zero is not the ground state. It is the energy of an electron that has just escaped from the atom and is no longer bound to the nucleus.
Energy level
An energy level is an allowed value of the total energy of an electron in an atom. In an isolated gas atom the allowed levels are discrete rather than continuous.
For a bound electron, the energy level is negative. This means the electron has less total energy than a free electron at . Energy must be supplied to remove the electron completely from the atom.
That negative sign is a common source of mistakes. It does not mean the photon emitted by the atom has negative energy. It means the level is below the chosen zero of energy. Photon energy is always a positive energy transferred by electromagnetic radiation.
Worked reasoning: why a bound level is negative
Suppose an electron is in an atom at energy . To become free, it must reach . The energy that must be supplied is:
The electron is bound because it needs this positive energy input to escape.
Photons and emission lines
An electron can move between energy levels only if the energy transfer matches the energy gap between the levels. The size of the gap is called .
Photon energy and level spacing
Here is the Planck constant, is the photon frequency, is the speed of light in a vacuum, is the photon wavelength, and is the positive energy difference between two levels. These equations are given in the OCR data booklet for this topic.
In a hot gas, atoms are excited by collisions or radiation. An excited electron can drop from a higher energy level to a lower energy level. The atom emits a photon, and the photon energy is exactly equal to the energy lost by the electron.
Emission line spectrum
An emission line spectrum is a dark background crossed by bright lines at particular wavelengths. Each bright line is produced by photons emitted during a specific electron transition.
Different atoms have different sets of allowed energy levels. Therefore they have different energy gaps, so they emit different sets of wavelengths. A spectral line pattern can be used like a fingerprint to identify the element producing it.
Worked example: wavelength from an energy-level diagram
An electron in a hydrogen atom moves from a level at to a level at . Determine the wavelength of the photon emitted.
The electron has moved to a lower energy level, so a photon is emitted. The energy of the emitted photon is the magnitude of the energy change:
Use , so:
The negative level values were needed to find the gap; the photon energy itself is positive.
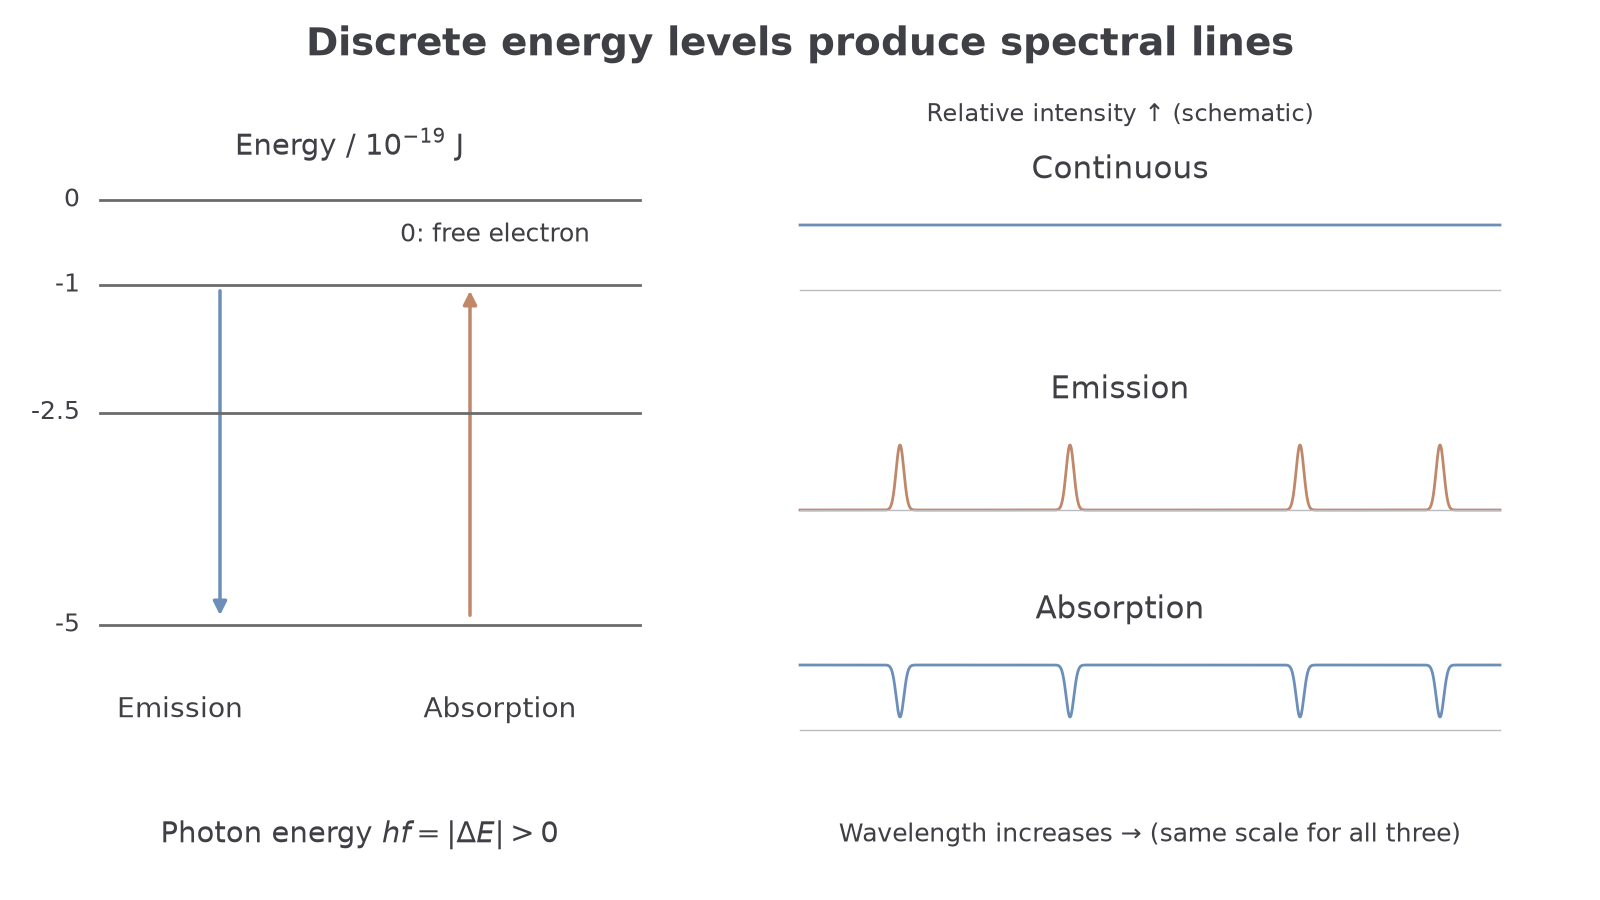
[DIAGRAM: asset_slug: 5_05_2a_spectra_energy_levels_and_diffraction_gratings__diagram_01; description: Emission and absorption use opposite transitions across the same energy gap; schematic intensity spectra distinguish continuous and line spectra.; caption: Energy-level transitions produce emission and absorption lines, distinguished from a continuous spectrum.]
Stellar spectra
There are three spectrum types you need to distinguish.
Continuous spectrum
A continuous spectrum contains a continuous range of wavelengths, with no missing wavelengths within the range observed.
A hot dense object, such as the bright surface layers of a star, can produce a near-continuous spectrum. In this lesson we use that as the background light source for understanding stellar spectra.
Absorption line spectrum
An absorption line spectrum is a continuous spectrum crossed by dark lines at particular wavelengths. The dark lines occur where photons of those wavelengths have been absorbed.
An absorption spectrum is produced when continuous light passes through cooler gas. Atoms in the gas absorb photons whose energies match jumps from lower to higher energy levels. Subsequent emission sends photons in many directions, so it does not replace all the photons removed from the original beam. Those wavelengths are then reduced in the light reaching the observer, so dark lines appear.
An emission line spectrum is produced by hot low-pressure gas, where excited atoms emit photons as electrons fall to lower energy levels. The important link is that, for the same atom, the absorption and emission lines occur at the same wavelengths. They correspond to the same energy gaps, just in opposite transition directions.
Continue this lesson.
You’re previewing NovaLearn without an account. Create a free account to read the rest.
Create free account