4.2.4 - Resistivity and temperature dependence
Resistance is not only about the component in front of you. A long thin wire has more resistance than a short thick wire of the same material, and different materials behave differently even with the same shape. In this lesson you will connect resistance to resistivity, use a metal-wire practical to determine resistivity, and explain how metals, semiconductors and NTC thermistors respond to temperature.
Resistivity as a material property
The resistance of a uniform wire depends on three things: the material, the length of the conducting path, and the cross-sectional area available for charge flow. Resistivity is the material part of that story.
Resistivity
Resistivity, , is a property of a material that describes how strongly the material opposes electric current. For a given material at a fixed temperature, it links the resistance of a uniform conductor to its length and cross-sectional area.
Resistance and resistivity
In this equation, is resistance in ohms , is resistivity in ohm metres , is length in metres, and is cross-sectional area in square metres. Rearranging gives:
The units come from the rearranged equation:
That unit is often where mistakes start. Resistivity is not measured in . The factor turns the resistance of a particular sample into a material property.
The shape dependence is physical. A longer wire gives charge carriers more material to pass through, so resistance is larger. A larger cross-sectional area gives more parallel paths through the material, so resistance is smaller. For the same material and temperature:
- doubling doubles
- doubling halves
- changing the material changes
Worked example: resistance of a metal wire
A uniform wire has resistivity , length , and diameter . Find its resistance.
First convert the diameter:
For a circular cross-section:
Now substitute into :
To two significant figures, .
Using a graph to find resistivity
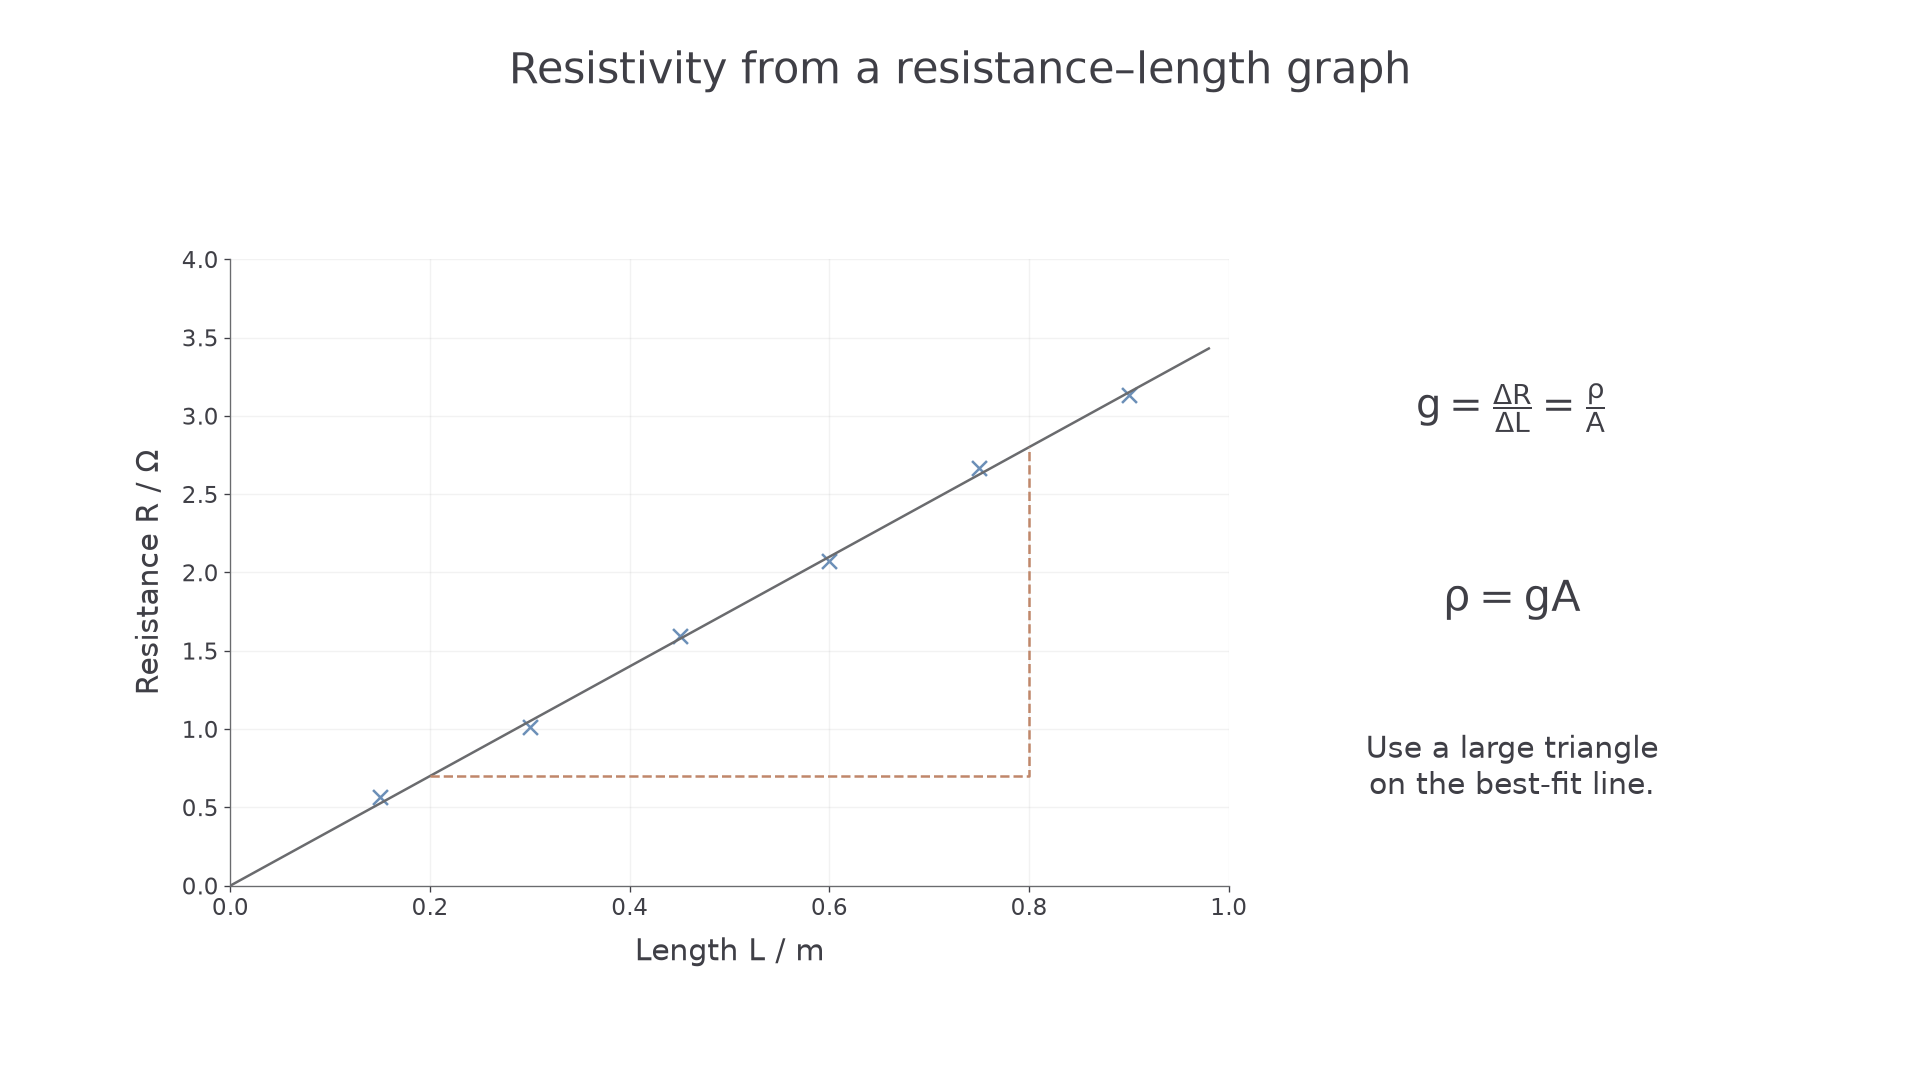
For one wire of fixed material and fixed diameter, and are constant. The equation
has the same form as if you plot on the vertical axis and on the horizontal axis:
So:
The graph method is usually better than using just one length because it uses all the readings and makes anomalies easier to spot. A good line of best fit should be thin and clear. Do not join point-to-point unless the data actually justify a non-linear curve; for a uniform metal wire at constant temperature, the expected relationship between and is linear.
Worked example: graph gradient
A metal wire has diameter . A graph of resistance against length gives a best-fit gradient of . Calculate the resistivity of the wire.
Convert diameter:
Calculate area:
Use :
To two significant figures, .
A constant extra lead or contact resistance gives . The intercept is then ; the gradient can still estimate . Do not force the fitted line through the origin when the data support a non-zero intercept. A contact resistance that changes between readings instead causes scatter or bias and is not removed by simply fitting a line.
To estimate gradient uncertainty, plot error bars from the measurement limits and draw the steepest and shallowest straight lines consistent with those bars. If the best gradient is and acceptable gradients span to , an appropriate symmetric estimate is , or about . A diameter uncertainty of contributes to area, so the conservative resistivity uncertainty is about . A visually steep or shallow line that misses the error bars is not an acceptable limiting fit.
[DIAGRAM: asset_slug: 4_02_4_resistivity_and_temperature_dependence__diagram_02; description: The gradient of a resistance–length graph is resistivity divided by cross-sectional area.; caption: The gradient of a resistance–length graph gives resistivity divided by area.]
PAG3 metal-wire resistivity method
The practical aim is to determine the resistivity of a metal. To do that, you need measurements of resistance, length and cross-sectional area. A typical method uses a long uniform resistance wire taped beside a metre rule, with a movable contact to vary the length of wire in the circuit.
A strong written method includes these steps.
- Measure the diameter of the wire using a micrometer or suitable calipers at several positions and in different orientations. Calculate the mean diameter.
- Calculate the cross-sectional area using .
- Connect the test length of wire in a low-voltage DC circuit with an ammeter in series.
- Connect the voltmeter in parallel across the measured length of wire, not across the whole supply.
- Use a fixed contact at one end and a movable contact or flying lead to set different lengths .
- For each length, record the p.d. and current , then calculate .
- Repeat readings where sensible, switch off between readings, and plot against .
- Find the gradient of the best-fit line and calculate .
Independent, dependent and control variables
In this investigation, the independent variable is usually the length of the wire. The dependent variable is the resistance . Important controls include the wire material, wire diameter, temperature, contact method and the supply setting used for the readings.
Heating matters because the resistivity of a metal changes with temperature. If the wire warms as current passes through it, the resistance can change for a reason other than length. Use a small current, switch off between readings, and avoid leaving the flying lead on one point for a long time.
Uncertainty reasoning should be specific.
Continue this lesson.
You’re previewing NovaLearn without an account. Create a free account to read the rest.
Create free account