S6 - Scatter graphs and correlation
Plot paired numerical data, describe the direction and strength of correlation, and draw an estimated line of best fit. Use it for predictions while distinguishing interpolation from extrapolation and association from causation.
Plotting paired numerical data
Can a shallow scatter-graph trend be stronger than a steep one? Yes: steepness describes a rate, while strength describes how closely points follow a pattern. We will separate those ideas before trusting any prediction.
You already know
Coordinates are ordered pairs: horizontal first, vertical second. Read each axis scale and label both the quantity and its units.
A teacher records practice time and quiz score for each pupil. The two measurements from one pupil must stay paired. Sorting each column separately would invent relationships that were never observed.
| Practice time, (minutes) | Quiz score, (out of ) |
|---|---|
Bivariate data and scatter graph
Bivariate data record two variables for each individual or object. A scatter graph plots each paired observation as one point on two numerical axes. For example, each pupil contributes one practice-time-and-score point. A two-way table of favourite colours and school houses is also bivariate, but those categorical labels do not make a numerical scatter graph.
Plot small crosses or clear points. Do not join successive points: these are different pupils, not one quantity changing through time. Two pupils may share the same practice time but have different scores, so two points can lie above the same horizontal position.
Worked example 1: plotting one pupil
Question. Plot the pupil who practised for minutes and scored . Non-calculator.
Plan. Use practice time horizontally and score vertically.
Why this step? Reversing the order would put a score on the time axis and a time on the score axis.
Answer. Mark a cross at .
Check. Its horizontal projection reaches minutes and its vertical projection reaches marks.
Change only the pupil selected from the table. The axis roles stay fixed.
Worked example 2: another observation
Question. Plot the pupil who practised for minutes and scored . Non-calculator.
Plan. Read both values from the same row and locate their intersection.
Why this step? Each row supplies one point. Combining the time from one row with the score from another creates false data.
Answer. Mark a cross at .
Check. The point is to the right of and above , agreeing with both larger values.
[DIAGRAM: asset_name: Practice time and quiz scores; asset_slug: aqa8300_s05_scatter; caption: Each cross represents one pupil's paired measurements, without joining the crosses; description: A scatter graph with practice time from 0 to 70 minutes horizontally and score from 0 to 20 vertically plots 10,3 then 20,7 then 30,8 then 40,12 then 50,13 then 60,17. The points 20,7 and 40,12 are labelled.]
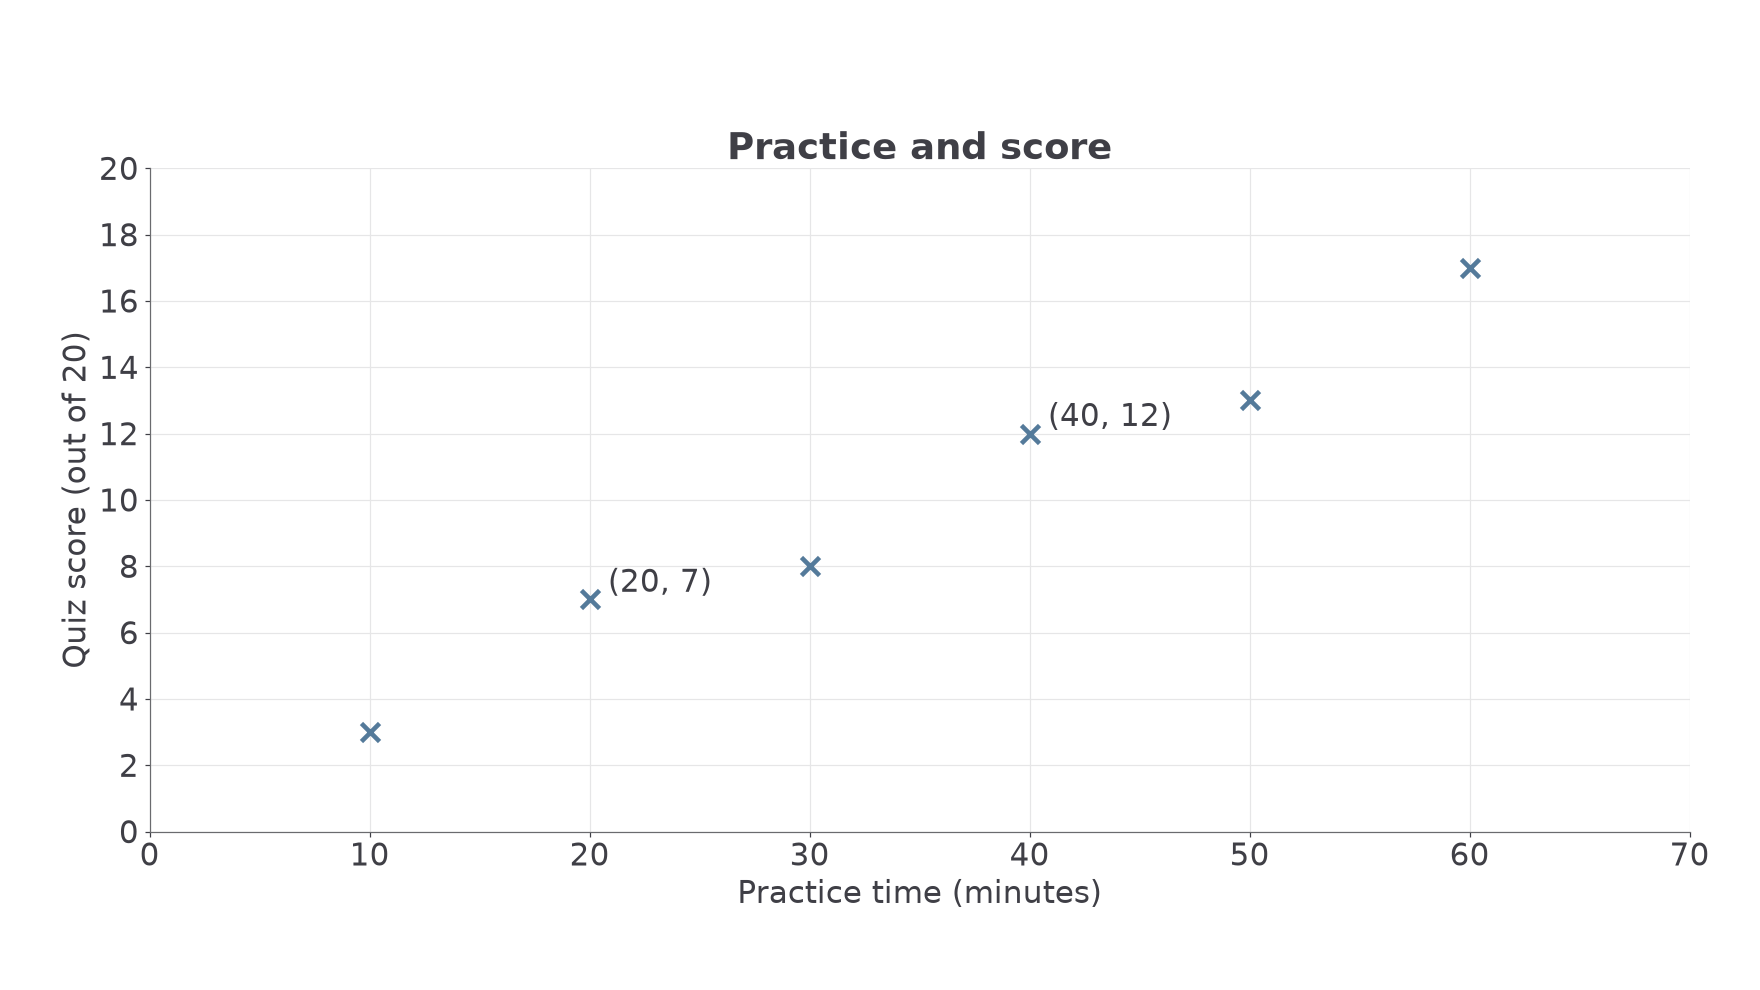
These plotting conventions are not on the formulae sheet: learn them.
Watch out
Wrong: sort the scores and times independently before plotting. Right: keep each original pair together. A scatter graph is about the link between the two measurements on the same individual.
The next two pairs belong to two different cyclists.
Direction and strength of correlation
Read a scatter graph from left to right. If larger -values tend to go with larger -values, the association is positive. If they tend to go with smaller -values, it is negative. A tendency allows exceptions; it does not require every point to rise or fall in order.
Correlation
Positive correlation means that as one variable increases, the other tends to increase. Negative correlation means it tends to decrease. No correlation means no clear increasing or decreasing association is evident. Strong correlation has points close to a clear trend; weak correlation has a more widely scattered trend.
Use both direction and strength when requested: “strong positive correlation”, for example. “Going up” describes an impression but does not give the statistical term. A single unusual point may be an outlier; it does not automatically cancel the pattern among the others.
[DIAGRAM: asset_name: Types and strengths of correlation; asset_slug: aqa8300_s05_correlation; caption: Direction and closeness to a trend are separate features; description: Four labelled scatter panels show strong positive correlation, weak positive correlation, strong negative correlation and no correlation. Identical axis ranges make direction easy to compare, but the captions emphasise spread around the trend rather than steepness.]
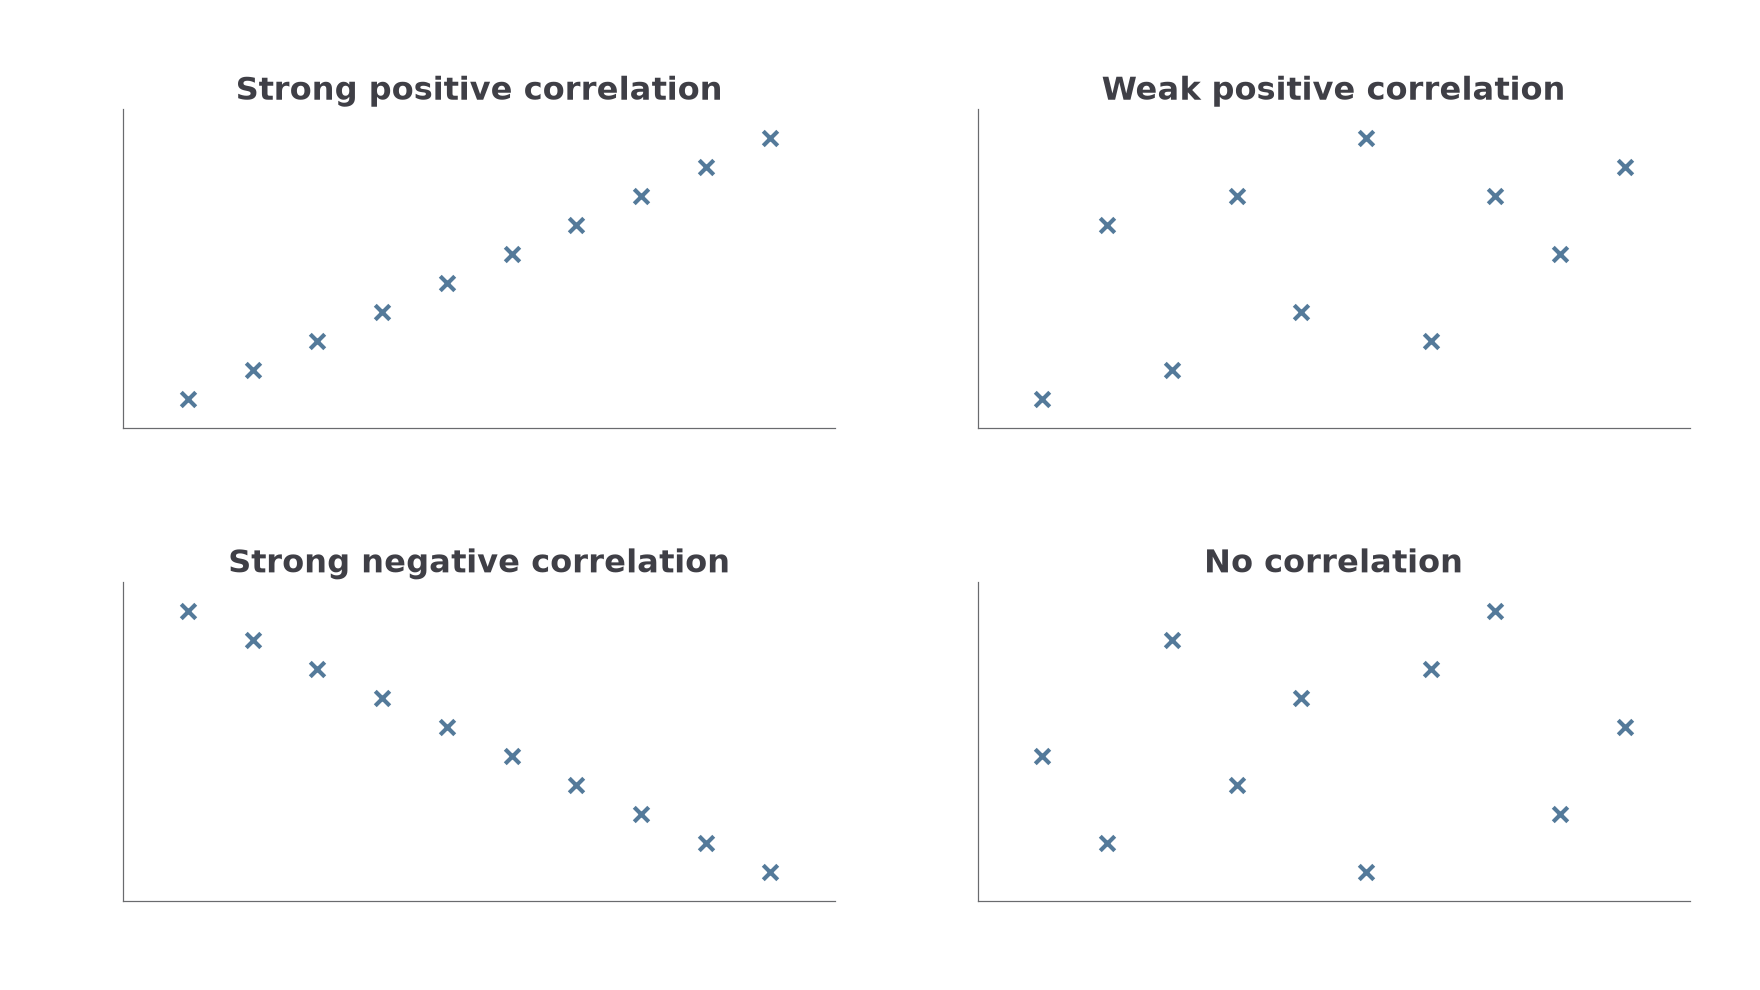
Here is a useful surprise: converting practice time from minutes to seconds makes every horizontal number times larger and the numerical gradient times smaller. It does not weaken the relationship between the pupils' measurements. Points exactly on a rising straight line show perfect positive correlation whether that line is shallow or steep.
Key idea
Strength is closeness to a trend, not the size of the gradient. Give direction and strength as separate pieces of information.
These terms are not on the formulae sheet: learn them. With no useful trend, a straight-line prediction has little support; do not draw a line simply because a question contains a scatter graph.
Drawing an estimated line of best fit
An estimated line of best fit summarises a roughly straight trend. Draw one straight line through the middle of the point cloud, following its direction, with points reasonably balanced above and below across the range.
It need not pass through a particular data point or the origin. Two extreme observations do not automatically fix it. Do not join the crosses with a zigzag. Use the overall pattern and a ruler; small differences between sensible estimated lines are expected.
Estimated line of best fit
A line representing the overall linear trend in paired numerical data. It supports estimates, not exact outcomes for every individual. It is appropriate when a roughly straight association is visible; a pronounced curve needs a different model.
The line drawn below for the practice data has equation . An equation is useful here because earlier work on straight lines lets us check readings; drawing an estimated line does not require calculating an exact regression formula.
Worked example 3: following the middle of the cloud
Question. Describe a reasonable estimated line of best fit for the practice-time data. Non-calculator.
Plan. Follow the rising central trend, then check the balance of the points.
Why this step? A line through the cloud should balance the deviations, rather than merely connect the first and last crosses.
Answer. A straight line near and is a reasonable estimate. Extend it across the observed range.
Check. Early, middle and late observations appear on both sides. The line is not forced through .
Change only one observation by adding a pupil at . That point lies well away from the existing pattern.
Continue this lesson.
You’re previewing NovaLearn without an account. Create a free account to read the rest.
Create free account