S1, S2 - Samples, tables and charts
Use a sample to learn about a larger group, while keeping its limits in view. Organise data in frequency and two-way tables, choose suitable charts, and construct and interpret bar charts, pictograms, vertical line charts, pie charts and time-series graphs.
Samples and populations
A school has pupils. Of pupils asked, want a later lunch. Is that enough to say that about pupils want it? The arithmetic is easy. Whether the answer is useful depends on who was asked.
You already know
A relative frequency is the number of times an outcome occurs divided by the number of trials. Fractions and percentages can scale a proportion from one total to another.
Asking every pupil would be a census. Asking some saves time, but their views may not represent everyone else's. Asking only pupils still in the lunch queue is especially risky: they may have a particular reason to want lunch moved.
Population and sample
The population is the whole group about which you want information. A sample is the smaller group actually investigated. A sample is biased if its selection systematically favours some members or views over others. For example, surveying a sports club about the whole school's favourite activity is likely to over-represent sport.
Choose pupils from a complete list using a random selection, rather than choosing friends or volunteers. A larger unbiased sample usually gives a more reliable estimate, but it still has sampling variation. Doubling a biased sample does not repair its selection. Even asking every member of one class leaves the other classes out.
Estimating a population count
Use this when the sample reasonably represents the population. The result is an estimate, not a guaranteed count.
Not on the formulae sheet: learn it.
First separate a calculation from the assumption that makes it useful.
Worked example 1: estimating from a random sample
Question. A random sample of out of pupils contains who want a later lunch. Estimate how many pupils want a later lunch. Non-calculator.
Plan. Apply the sample fraction to the whole school.
Why this step? The fraction describes support, while supplies the size of the group being estimated.
Answer. About pupils, assuming the random sample represents the school reasonably well.
Check. is more than half of ; is more than half of .
Change only the selection method. The same arithmetic can now hide a serious weakness.
Worked example 2: the same figures from a biased sample
Question. The pupils are instead the first people at the lunch queue. Again want a later lunch. Work out the estimate and explain one limitation. Non-calculator.
Plan. Calculate as before, then connect the limitation to the people selected.
Why this step? A correct calculation cannot remove bias in the data that went into it.
Answer. The estimate is . It may be unreliable because early queue users may have different lunch preferences from pupils who arrive later or do not queue.
Check. Both surveys give , but only the first deliberately gave all pupils a chance of selection.
Here is a useful surprise: two surveys can produce exactly the same table and still deserve different levels of trust. A chart cannot show a selection bias that was never recorded.
Watch out
Wrong: “The sample is unreliable because it does not include everyone.” That describes every sample. Right: identify a particular missing or over-represented group and explain why its responses might differ.
Keep the inference and its limitation together in the following question.
Frequency tables, bar charts and pictograms
A list of favourite lunch choices is hard to scan. A frequency table counts each category once, then a chart makes the comparison visible.
Frequency and categorical data
Frequency means how many times a value or category occurs. Categorical data are labels, such as soup, pasta and salad. Their order need not have a numerical meaning. A pupil's height is numerical data, not categorical data.
For the responses soup, pasta, salad, pasta, soup, pasta, the frequencies are soup , pasta , salad . Tally each response in one row. The total frequency must match the number of responses.
A bar chart has equal-width bars with gaps, labelled categories and a frequency axis starting at zero. Categories can be reordered. A pictogram uses equal-sized symbols and a key; a half symbol means half the key's value. Do not enlarge a symbol to show a larger count, because its area then misleads.
[DIAGRAM: asset_name: Bar chart and pictogram of lunch choices; asset_slug: aqa8300_s01_bar_pictogram; caption: The same frequencies can be shown by bar heights or by symbols with a key; description: Left panel has separate equal-width bars for soup 12, pasta 18 and salad 6 with a frequency scale from zero. Right panel uses a full circle for four pupils and a half-circle for two, giving three circles for soup, four and a half for pasta and one and a half for salad.]
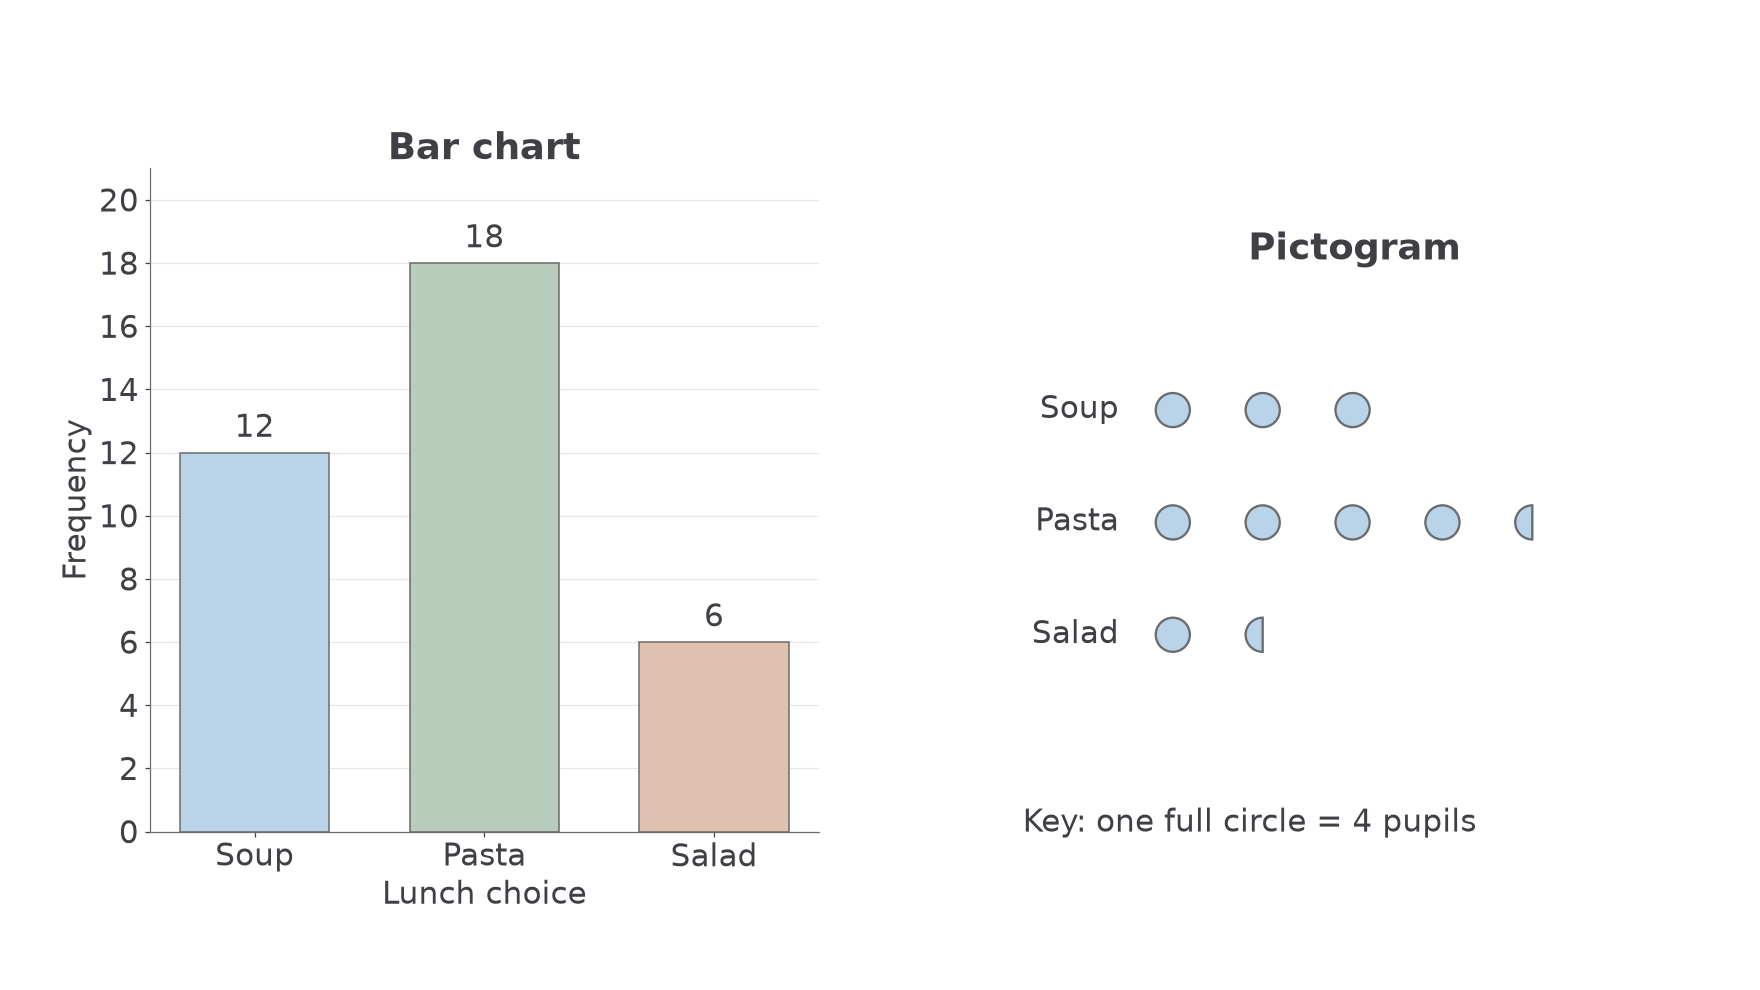
Choose a bar chart for comparing several categories accurately; a pictogram is friendly for a few counts when a simple key works. These chart conventions are not on the formulae sheet: learn them.
Worked example 3: constructing a bar chart
Question. A frequency table gives soup , pasta , salad . Describe how to draw its bar chart and work out the total. Non-calculator.
Plan. Choose a frequency scale covering the largest value, then draw three separate bars.
Why this step? A zero baseline lets the heights show the actual sizes, rather than exaggerating differences.
Answer. Label the horizontal categories and vertical axis “Frequency”. Use equal-width, separated bars of heights , , . There are responses.
Check. Pasta's bar is three times salad's height, matching .
Change only the representation: keep the frequencies, but use a pictogram key.
Worked example 4: constructing a pictogram
Question. Show the same frequencies using one full circle for pupils. Non-calculator.
Plan. Divide each frequency by the value of one symbol.
Why this step? Half a circle means pupils because the full circle means .
Answer. Draw , and equal-sized circles in the three labelled rows, and write the key.
Check. The full-symbol equivalents represent pupils.
Always read the key before counting pictures.
Watch out
Wrong: symbols means pupils. Right: with a key of , it means pupils. It is the symbol count, not the pupil count, that can include halves.
The next key has a different value, so a half-symbol represents a different count.
Vertical line charts for discrete data
A number of pets can be , , or . It cannot be . The numerical positions matter, so leave their spacing intact.
Discrete numerical data
Numerical data taking separate possible values, often counts. A vertical line chart shows each value at its correct position on a numerical axis, with a line whose height is its frequency. For example, number of pets is discrete; measured mass is continuous.
Include a missing value's position even if its frequency is zero. Unlike a categorical bar chart, moving “three pets” to the left of “one pet” would destroy the scale. Do not join the tops: the lines show frequencies at separate values, not a change through time.
[DIAGRAM: asset_name: Vertical line chart for pets; asset_slug: aqa8300_s01_vertical; caption: Each possible pet count keeps its numerical position, including zero frequency at three pets; description: Numerical horizontal axis shows 0 to 4 pets at equal spacing, frequency axis starts at zero. Vertical lines have heights 5, 8, 4, 0 and 3 respectively, with an open marker at the zero-height value three.]
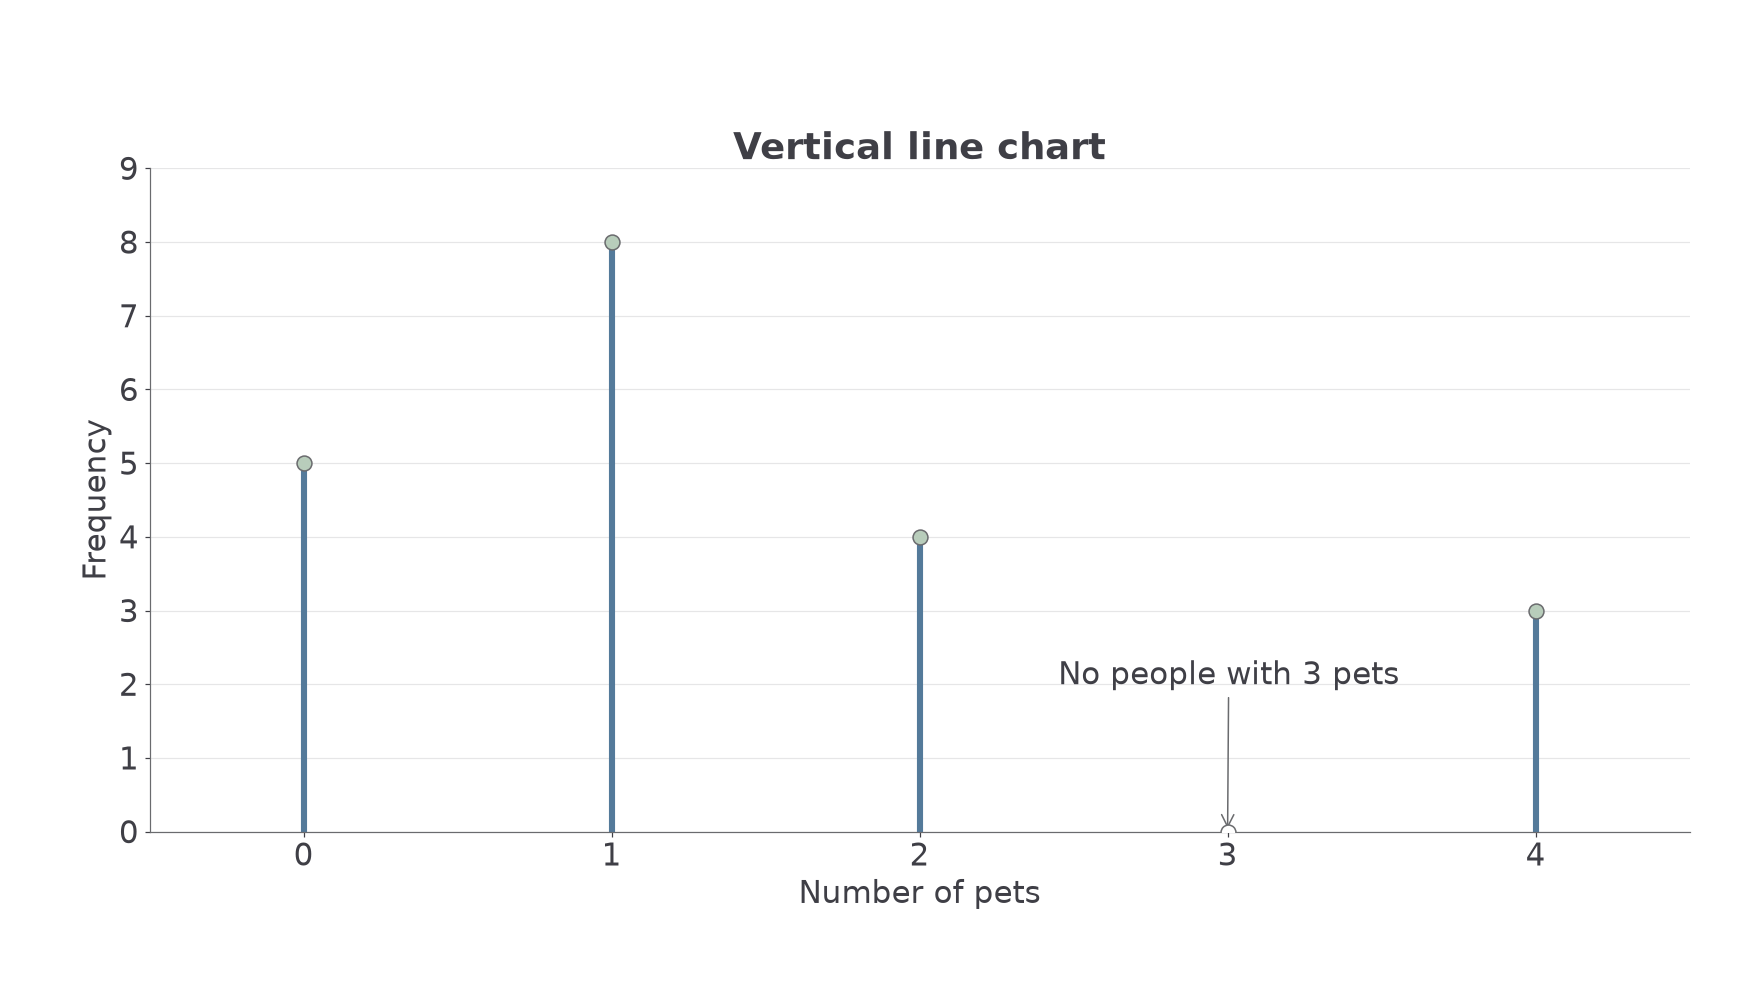
The method is a plotting convention, not on the formulae sheet: learn it.
Worked example 5: a numerical frequency chart
Question. Pet counts have frequencies . Describe the vertical line chart and work out how many people have at least pets. Non-calculator.
Plan. Plot each frequency above its number, then add the qualifying frequencies.
Why this step? “At least” includes the boundary value .
Answer. Draw the vertical lines shown. There are people with at least pets.
Check. There are people in total and with fewer than ; .
Change only the boundary: “more than” excludes the named value.
Worked example 6: reading a strict boundary
Question. Using the same table, work out how many people have more than pets. Non-calculator.
Plan. Add only frequencies above on the horizontal axis.
Why this step? The horizontal values are pet counts; the heights are people. Add heights, not .
Answer. people.
Check. Removing the people with exactly pets from the previous leaves .
Read both axes before using a chart.
Continue this lesson.
You’re previewing NovaLearn without an account. Create a free account to read the rest.
Create free account