A13 - Translating and reflecting graphs (Higher)
A small change to a function's equation can move its whole graph. In A13 you will translate graphs horizontally and vertically, reflect them in either coordinate axis, and sketch the result using a few key points. Tracking coordinates explains the signs, so you do not have to guess which way a graph moves.
Vertical translations (Higher)
A point lies on . If the equation becomes , does that point move right or left? The plus sign is tempting. Keep the question while we first move outputs, where the direction is more direct.
You already know
means the output of function f at input . A coordinate pair records input first and output second. A quadratic's turning point and a few points on either side locate its shape.
If an old output is , adding outside the function makes the new output . The input has not changed. Every point moves the same distance in the same direction: this is a translation. Shape, size and orientation stay the same.
Moving a graph vertically
For a fixed number ,
If , translate up units. If , translate down units. If , the graph stays where it is.
Not on the formulae sheet: learn it.
For a sketch, move distinctive points first, then draw the same shape through them. Move the whole graph, including any asymptote: adding to moves its horizontal asymptote from to .
Worked example 1: adding to the output
Question. The graph , where , has turning point and points and . Describe the translation to , and give these three new points. Non-calculator.
Plan. Keep each input and add to each output.
Why this step? The added acts after the function has produced its output, so it changes heights only.
Answer. A translation units upwards. Sketch the same upward-opening parabola through , its minimum , and .
Check. At , .
Change only the sign of the outside constant. Every height now moves down instead of up.
Worked example 2: subtracting from the output
Question. Describe the translation from the same graph to , and give the three new points. Non-calculator.
Plan. Subtract from each old height, leaving the input alone.
Why this step? Subtracting from every output lowers the graph; it does not change the horizontal position of its symmetry line.
Answer. A translation units downwards. The minimum is , with the other points and .
Check. The two outside points still lie units either side of , at the same height.
[DIAGRAM: asset_name: Vertical translations of an off-centre parabola; asset_slug: aqa8300_a27_vertical; caption: Adding outside the function moves every height up; subtracting moves every height down; description: Two coordinate panels show the original blue parabola y equals open bracket x minus 1 close bracket squared minus 2. The clay curve in the first panel is three units higher and in the second is three units lower. Each old and new turning point is marked, and vertical arrows connect the turning points.]
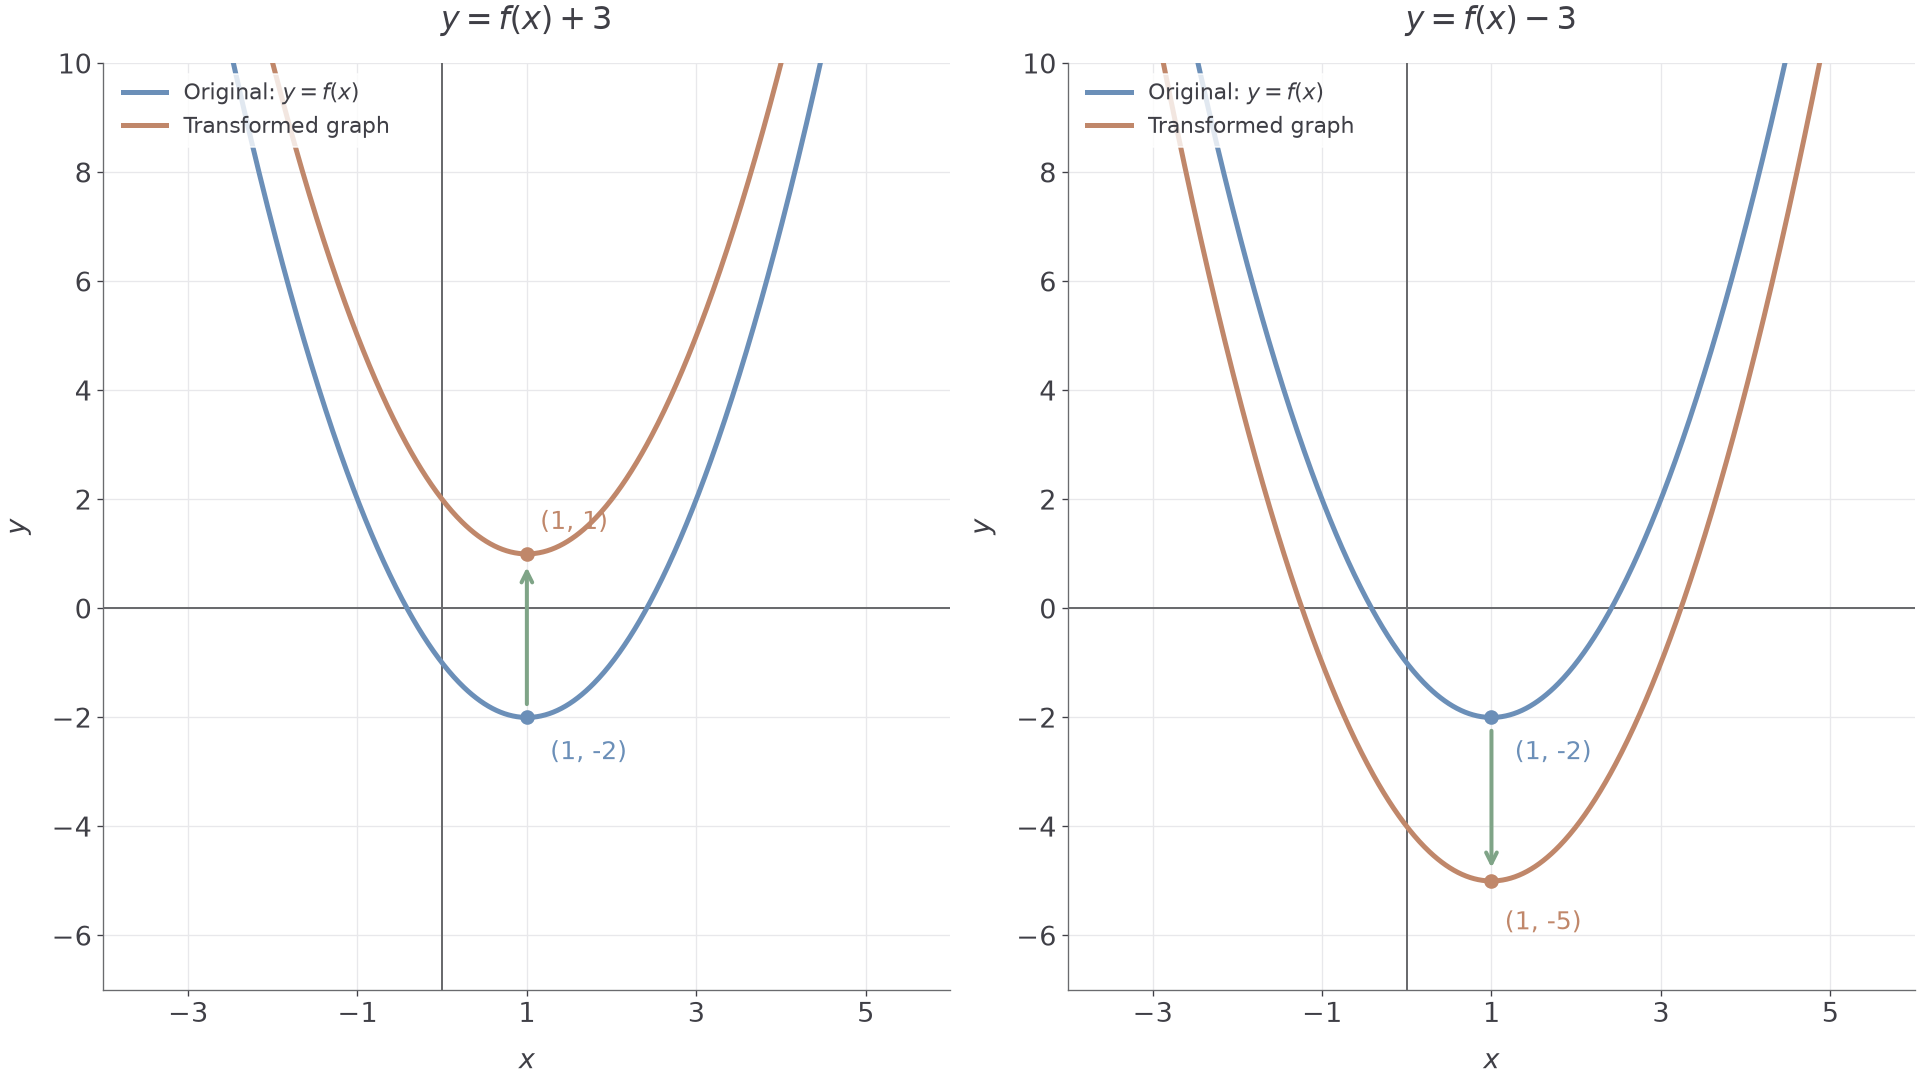
The new -intercept comes from moving the old -intercept. The new roots usually do not come from moving the old roots horizontally: crossings occur where the moved graph meets the fixed axes.
Watch out
Wrong: “ moves the graph left .” Right: the subtraction is outside the function, so only heights change. It moves down .
Use the downward translation with a different distance and a different given point.
Horizontal translations (Higher)
Changing the input moves a graph horizontally. To understand the direction, ask which new input produces an old output. If , then at , because . The point moves right .
For , the old input is produced when . This time the point moves left . The sign inside the function describes the input operation, rather than the direction of travel.
Moving a graph horizontally
For a fixed number ,
For , the first is right units and the second is left units. Heights stay unchanged. A zero shift leaves the graph unchanged.
Not on the formulae sheet: learn it.
Solving a tiny input equation is safer than memorising “opposite sign”. It works for a parabola, a cubic, a reciprocal curve or a function supplied only as a drawing.
Worked example 3: subtracting inside the function
Question. Use the original graph . Describe the translation to and give the new turning point and the images of and . Non-calculator.
Plan. Make each new input minus equal to the old input.
Why this step? The new graph must feed the old turning-point input into f, so its own input must be .
Answer. A translation units to the right. The minimum is , with points and .
Check. At , .
Change only the sign inside the function. The input equation now sends every point left.
Worked example 4: adding inside the function
Question. Describe the translation from the same original graph to , and give the corresponding three points. Non-calculator.
Plan. Make the new input plus equal to each old input.
Why this step? Adding inside f means the new input needs to be smaller to reach the same old input.
Answer. A translation units to the left. The minimum is , with points and .
Check. At , .
Continue this lesson.
You’re previewing NovaLearn without an account. Create a free account to read the rest.
Create free account