A8–A10 - Coordinates and straight-line graphs
A graph turns an equation into a picture of all its solutions. You will locate coordinates in A8, plot straight-line equations in A9, and connect their steepness and axis crossings to their equations in A10. These links let you predict a line before drawing it.
Coordinates in four quadrants
A point moves three squares left and two squares up from the origin. Is its position or ? The order matters: coordinates are instructions, not a bag of two numbers.
You already know
Negative numbers lie to the left of zero on a horizontal number line. Substitution means putting a given value in place of a letter, including its sign.
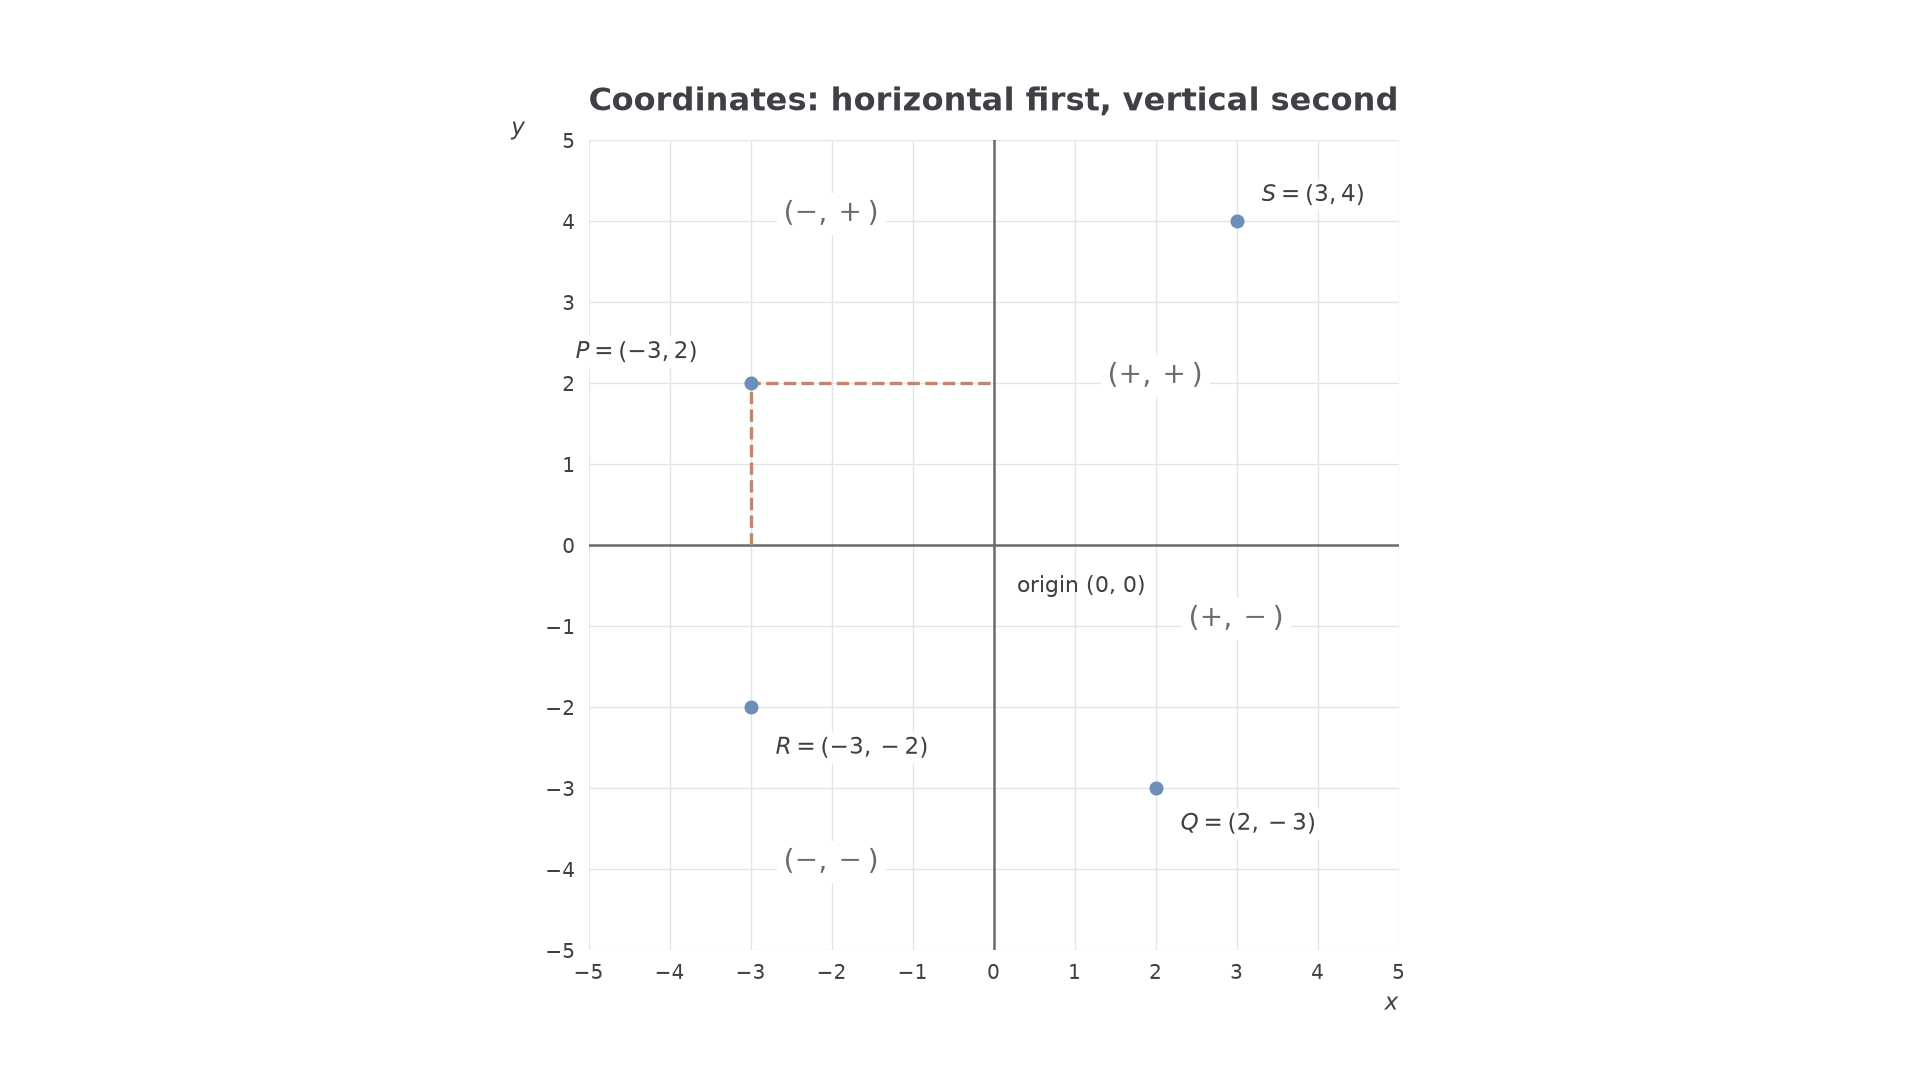
Two number lines cross at the origin, . The horizontal line is the -axis and the vertical line is the -axis. For , move horizontally to , then vertically to . Positive means right or up; negative means left or down. Read the scale before counting: one square need not represent one unit.
[DIAGRAM: asset_name: Coordinates in four quadrants; asset_slug: aqa8300_a18_quadrants; caption: The first coordinate gives the horizontal position and the second gives the vertical position; description: Equal-scale coordinate axes from minus 5 to 5, with P at minus 3 comma 2, Q at 2 comma minus 3, R at minus 3 comma minus 2 and S at 3 comma 4. Quadrant signs and origin are labelled. Dashed horizontal and vertical guides locate P.]
Coordinates
An ordered pair locating a point: is its horizontal position and its vertical position. The four regions between the axes are quadrants. A point on an axis is not inside a quadrant.
The signs locate the region: top right has , top left , bottom left , and bottom right . This coordinate convention is not on the formulae sheet: learn it.
Worked example 1: locating a point
Question. Describe how to locate . State which side of each axis it lies on. Non-calculator.
Plan. Use the first number horizontally and the second vertically.
Why this step? The first coordinate is always horizontal, even when it is negative.
Answer. is left of the -axis and above the -axis, in the top-left quadrant.
Check. Its signs are , which match left and up.
Change only the sign of the second coordinate. The horizontal position stays fixed.
Worked example 2: changing one sign
Question. Describe how to locate . State which side of each axis it lies on. Non-calculator.
Plan. Keep the horizontal move, then use the negative vertical coordinate.
Why this step? Changing 's sign moves the point to the opposite side of the horizontal axis, not the vertical axis.
Answer. Left of the -axis and below the -axis, in the bottom-left quadrant.
Check. and have the same -coordinate, so they are vertically aligned.
An axis can be recognised without a picture: is on the -axis and is on the -axis.
Watch out
Wrong: “ means 2 left and 3 up.” Right: read in order, 3 left and 2 up. Swapping the coordinates usually gives a different point.
Try the sign rule with a point below the origin.
Plotting a straight-line equation
A point is on a graph exactly when its coordinates make the equation true. For , the point belongs because ; does not.
Choose several -values, substitute to find , then plot the ordered pairs. If the equation represents a straight line, use a ruler to draw one continuous line through the points. Two distinct points fix a line, but a third point checks your arithmetic. That is a useful surprise: infinitely many solutions can be fixed by just two positions.
Graph of an equation
The set of points whose coordinates satisfy the equation. For a straight-line equation, its plotted points lie on one straight line. A table lists some solutions, not all of them.
These non-calculator examples use the same -values so that a change in the equation is easy to see.
Worked example 3: a rising line
Question. Complete a table for at , then describe its graph.
Plan. Substitute each -value, plot the four coordinates, and join with a ruled line.
Why this step? Each table entry must use its own -value; the equation supplies the matching height.
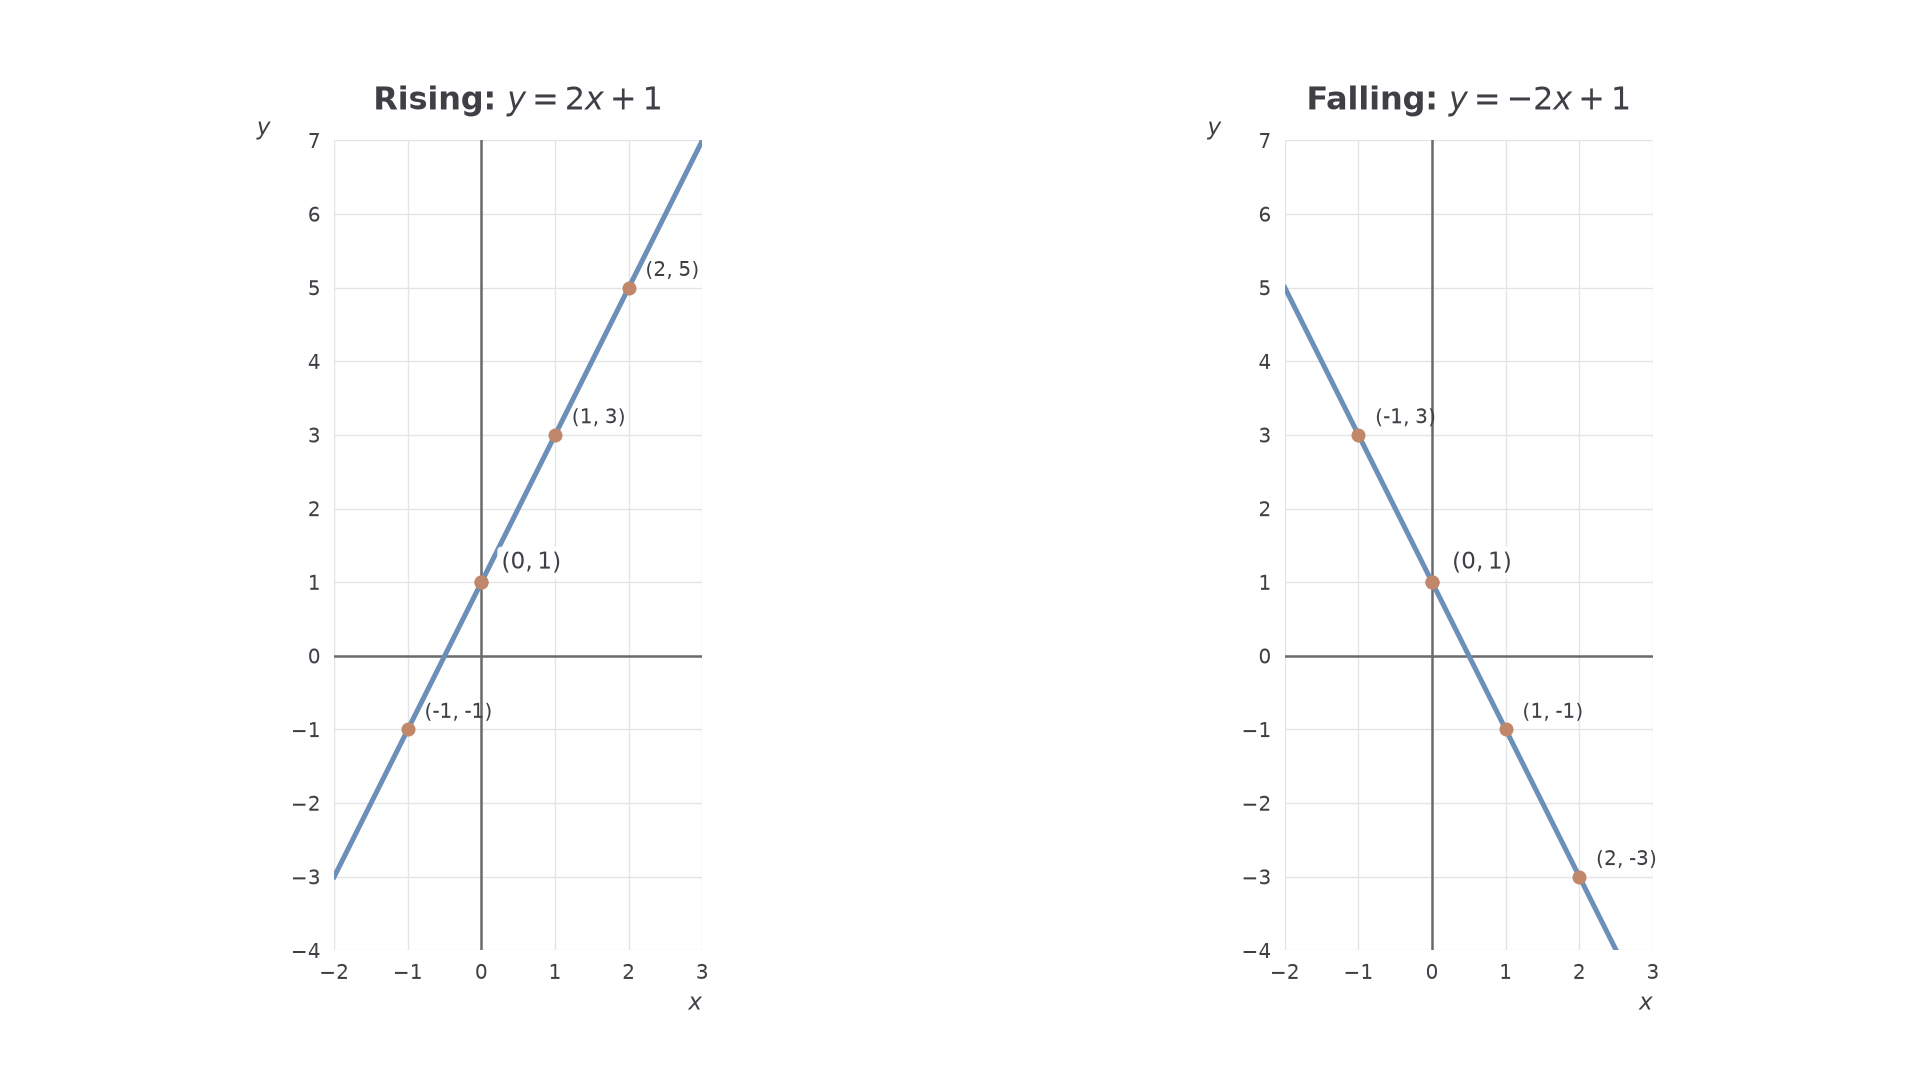
Answer. Plot , , , . They form a line rising from left to right.
Check. Each increase of in increases by , so the points should line up.
Change only the sign of the coefficient of . The line will fall rather than rise.
Worked example 4: a falling line
Question. Complete the same table for , then describe its graph.
Plan. Substitute into the new equation, keeping brackets around negative inputs.
Why this step? is , not ; the sign of the input matters as well as the coefficient.
Answer. Plot , , , . The line falls from left to right.
Check. Every step of right changes the height by .
[DIAGRAM: asset_name: Rising and falling straight lines; asset_slug: aqa8300_a18_plot_lines; caption: Changing the coefficient from positive 2 to negative 2 reverses the slope while keeping the same y-intercept; description: Two equal-scale coordinate panels, left showing y equals 2x plus 1 with the four worked-example points and right showing y equals minus 2x plus 1 with its four points. Both y-intercepts at 0 comma 1 are labelled.]
Some straight-line equations have only one variable. The line contains every point with height , so it is horizontal. The line contains every point with horizontal coordinate , so it is vertical. These facts are not on the formulae sheet: learn them.
Watch out
Wrong: joining plotted points with a zigzag or a freehand curve. Right: if the equation gives a straight line, use a ruler. A point that misses the line is a prompt to check its substitution or plotting.
You can check a table in writing without drawing a graph in the answer box.
Continue this lesson.
You’re previewing NovaLearn without an account. Create a free account to read the rest.
Create free account